Key Picture…
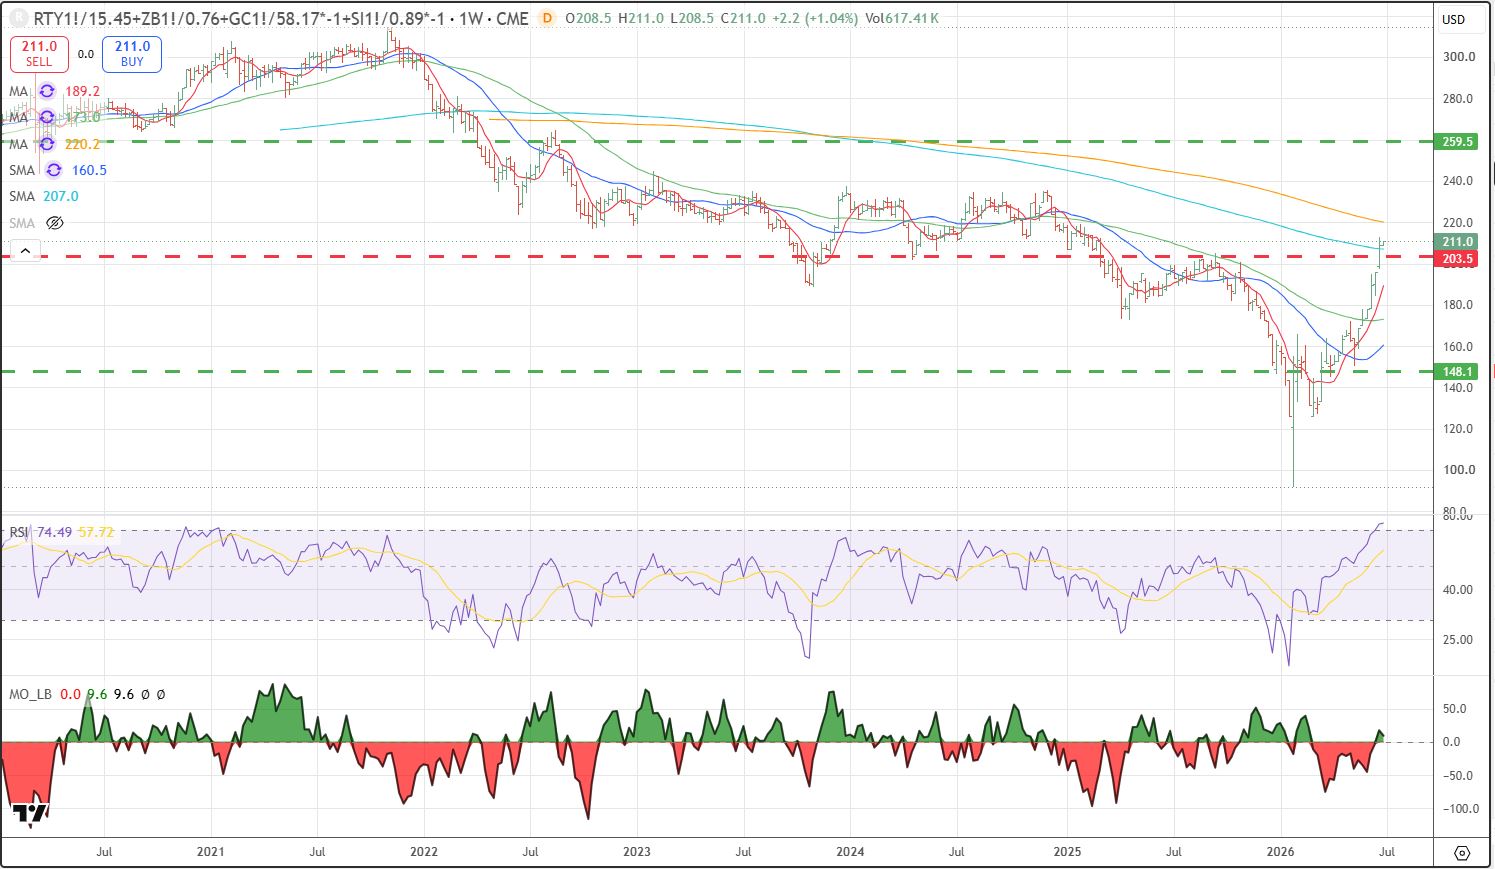
Thanks you markets, you have given me the opportunity to show you this chart again.
As you know I take a different tack on all this market stuff, to me I continue to look at gold and silver prices as a function of a fundamental optimism/pessimism psychological framework.
Here are the points that jump out at me using my measurement framework. This framework is based around a simple algorithm portfolio of equal dollar weighting of the four components (long Russell stocks and long 30Yr Bonds), plus (short gold and short silver).
When there is an optimism trend, long stocks and bonds push the index higher, when there is a pessimism trend, declining stocks and bonds plus short gold and silver push the index lower to an apex moment.
The two most recent apex moments were Dec 2021, huge government liquidity, and January 2026, huge levels of anticipated pessimism.
See Chart based on weekly data, updated today. We have just crossed above the swing point at 203. To me that means a general trend higher on stocks, maybe 9600 on the S&P and a general trend lower on Gold to maybe 2100 area.
Leave a Reply