The Fed Backstory, October 30, 2021
The FED meets this coming week with a lot on the table. One thing in the background is whether Powell should be re-nominated. While I have many problems with the philosophy of his leadership, I will say the following, he should be re-nominated so that he is around to face the music. If Biden discards Powell, then Biden will be blamed for the music as it blares forth.
Over the past ten years we have been pointing out the periods when excess stimulus by the Federal Reserve was sending a poor message to the production side of the economy. Ironically, the speculative side of the economy picked up on the message and ran with it.
This leaves us with an economy that ignores supply/demand analysis. The assumption for the FED is that the way to make things happen is to provide funny money to aggregate consumption and let the production side chase the rabbit.
This leaves us with an economy facing supply constraints as the rabbit is nothing other than a phantom (appropriate maybe for Halloween today).
Before I go on I would like to mention that one of my favorite analysts, John Mauldin has a relevant letter this morning, Trick or Treat Economy. See link at the end below.
Here is a chart that goes back to an important time in recent economic history, 2005, a time when the Executive branch and the FED pushed a housing initiative to try and boost the economy out of the 2000 economic Crash, arguably the most significant Crash since 1929 (see Macro Cycle chart next) where the importance of 2000 is readily apparent. Nothing the FED has done since has fixed anything. How could a problem created by excess liquidity and low interest rates be fixed by even lower rates?

So lets dig down into the detail on economic factors since, shown in a number of indexes we have created here in Chart F-2.
Economic Inputs and Factors and relationship with GDP..
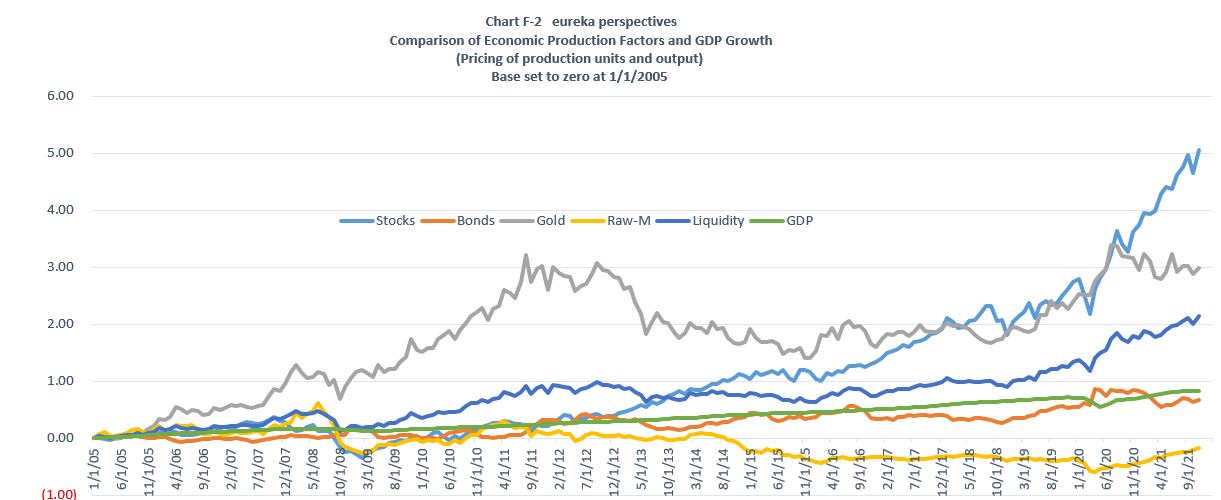
Here is what we see in this picture,
- First, the influence of asset speculation is evident in the stock index numbers.
- Second, bond prices, and by extension the inverse, interest rates, have basically tracked GDP, ie low growth.
- Third, Gold has overall been the most exuberant benefactor, especially into the 2011 QE2 blowout, but it did hit a brick wall in October 2020 when it became apparent that speculative stock forces were becoming the play.
- Raw material prices, using the CRB index, have been generally subdued over the whole period as deflation has been the controlling factor. This appears to have changed as a result of the COVID response in March 2020. Since then raw materials have come out of their shell, and now are one of the factors that have pulled the economy out of the deflationary wave and have set up the very early part of the inflation wave (see Chart F-3 below) which compares raw material prices and GDP. This inflation wave is being given additional input from labor/wage increases.
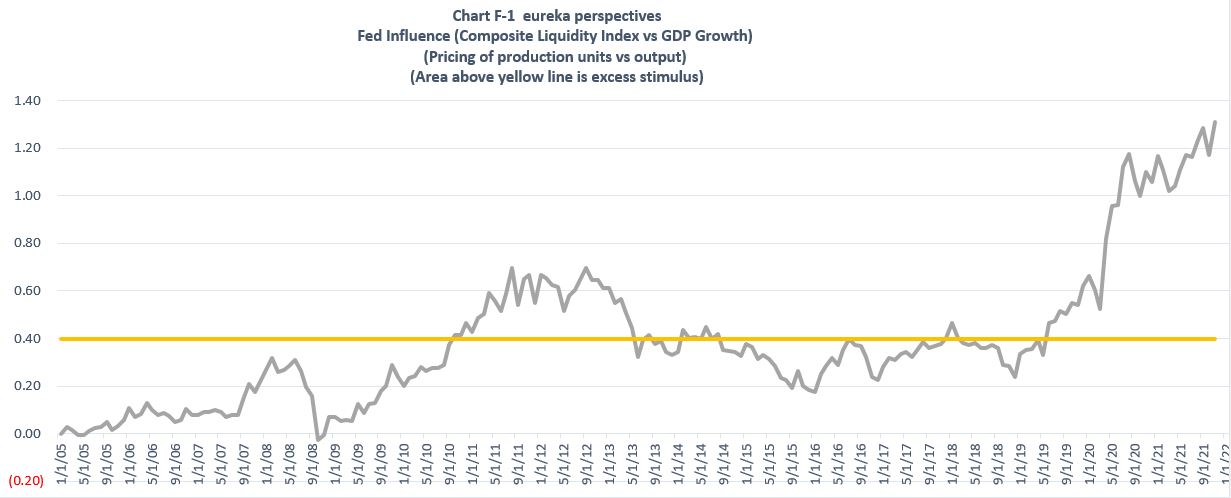
- And then we have a chart line that we call liquidity which is a composite index of stock, bond, raw material, and gold valuation. It kind of tracks the middle ground, pushed up by stock and gold valuations and pushed down by raw material valuations. Chart F-1 below shows the impact of that liquidity.
Excess Stimulus, something to study?
- Chart F-1 makes a comparison between overall FED induced liquidity and resulting GDP growth. We call the differential above the yellow line, excess liquidity. You will note that excess liquidity occurred after the FED’s QE’s, October 2010 to June 2013 period, next with the FED rescue of the Trump programs June 2019 to January 2020, and then the FED Covid response from March 2020 to present.
Next we compare Raw Material prices and GDP in a Macro sense..
Here is Chart F-3 which shows how the long wave of deflation from raw materials prices ended in March 2020 and has become major factor that needs to be watched relative to on-going inflation pressures. This is represented in a comparison between GDP and raw material costs. We see this is the first sustained uptick in the down wave that has prevailed since June 2008 when housing inputs created a high.

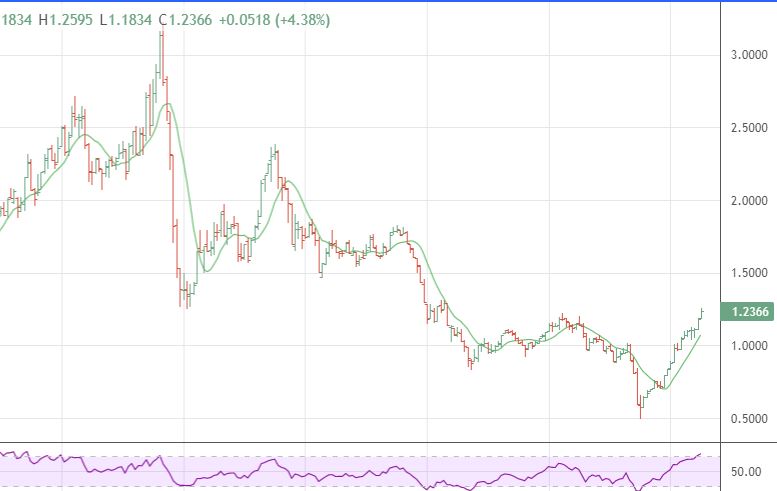
What is the Impact of Raw Materials prices and 10 Yr Bond prices?
While raw material prices are generally viewed as being determined by supply demand equations, it is still a fact that higher RM prices can put pressure on 10 year yields. So far in the upward wave for materials pricing we have had this response: 10 year bond prices appear to be less affected as the FED has successfully held down yields, but the pressure is building. (chart here divides CRB prices by 10 Yr Bond prices, not yield).
So, How does this all get resolved?
It will take FED Leadership and a FED body that will govern by solid economics that believes in basic Supply and Demand principals. That will require changes, changes governed by politicians with strong character. That kind of character is in short supply these days.
Call me hopeful that changes will occur, but sad at the inequality that has manifested itself over the past 40 years.
More than likely the change that is needed will require a problem so chaotic that negative interest rates and government borrowing will not have any impact and a drastic reset of asset and debt prices will ensue.