2024 Outlook / Forecast…
January 4, 2024
Probably the big question looming over Wall Street’s forecasts for 2024 is; how did most of the mainstream economists and guru’s miss the whole 2023 thread?
COMMENTARY…
Long time readers of our blog know that I have been focused on the new economy that has evolved over the past four years and has been accelerated by dramatic changes to most aspects of people’s lives and work, compliments of Covid. Here I will try to number a few of those changes along with some of the economic threads that are breaking out into full bloom.
- People don’t want to have to travel to an office, a majority want to work from home if possible, at least for three days a week.
- People have found that they can get jobs that they enjoy and in which they can be more productive. We have seen unprecedented job change numbers coming into this new period.
- With people working more from home, retailers are in a quandary as to what items to inventory, what times to have restaurants open and how to staff for new eating schedules. Amazon is a big winner in all this, they don’t have to think about brick and mortar stores. Food delivery services are also a winner, in short, everything is changing. Worker production efficiency is increasing and that is one of the things fueling the phantom growth that Wall Street missed.
- Deglobalization is bringing work back to the US, more jobs for everyone.
- Climate Change enterprise is changing the face of the infrastructure, energy, and environmental direction, also creating jobs with President Biden leading the movement.
- While the conservative press and the conservatives are fighting it all the way, the fact is, the effects of climate change are going to be massive, the glaciers are melting and that affects everything. One just has to be patient while investing in this area. I still see EV, Solar, Batteries, Infrastructure/building renewal, Biotech, as areas in which to concentrate for the future.
ANALYTICS…
So where might many analysts have some big themes wrong?
It is interesting, especially with the people who missed the 2023 market direction, Inflation still seems to be on their mind. Here are a couple of answers to what were the principal drivers of inflation since 1980? Compliments of Microsoft’s AI Bing.
- “The Dominant drivers of inflation since 1980 has been monetary policy, oil prices and globalization.”
- Rising commodity prices and supply chain disruptions were the principal triggers of the recent burst of inflation.
Since it appears that Bing still has a lot to learn in terms of forecasting, we will just use those comments as historical inputs, but we will discuss what direction is evolving out of that history.
- Next we will look at these pieces that everyone is worried about; monetary policy, oil prices, commodity prices, supply chains, along with recession talk and lower interest rates as a result of a slower economy.
So, is there going to be a recession, a majority of economists thought so a year ago. Maybe first we look at what have been the causes of recessions in the last 50 years. Covid, Housing Crisis, 9-11, Iraq War, high inflation, over 15 % interest rates, oil embargo.
When I look at these prior recession causes it appears that either fixes are in place or current dynamics don’t fit. I would guess that whatever causes the next recession will be something new.
For me the most out of kilter happening at this time is Bitcoin and Crypto. So a blowup of this is probably the biggest risk out there, but I don’t see that as happening sooner than four or five years down the road. A Ponzi scheme of the current magnitude would seem to be able to attract a much bigger mass of suckers. So as long as the real economy can generate real money I see regular people investing a portion of their income here. When it implodes for some outside reason, it will make 1929 and 2008 look like child’s play.
BASE CONCEPTS…
Our forecasts for a number of years have used indexes with a starting point of Jan 1 2005, a time before “Funny Money” became the market. In many ways as “Funny Money” influence has waned since the peak in the March 2022 to June 2022 period. We are seeing the economy and the markets being forced to use real economics.
Ironically the result is that instead of the doomsayers prediction of an economic collapse once the FED got tough, is that we actually see a return to efficient markets and real growth. No doubt instead of using money to play games, money is being allocated to areas where things work and growth is possible. The losers that are slowly cropping up are consumer type areas that are based on fluff rather than production of needed products. One current example is restaurant food vs home meals, the cost spread is huge and growing, unsustainable.
2024 will see more of this and no doubt a lot of volatility in the first half of the year as players juggle their election forecasts, but as the election trends start to coalesce and winners become apparent after August 1, we expect to see a growth direction reappear. So maybe a lack luster first half after the S&P stalls out in the 5100 area and a strong second half would be our guess at the moment.
- Next are some simple Chart Analytics based on our work and models that provide a good picture of the economic story…
Chart F-1 Composite Liquidity Index vs GDP Growth
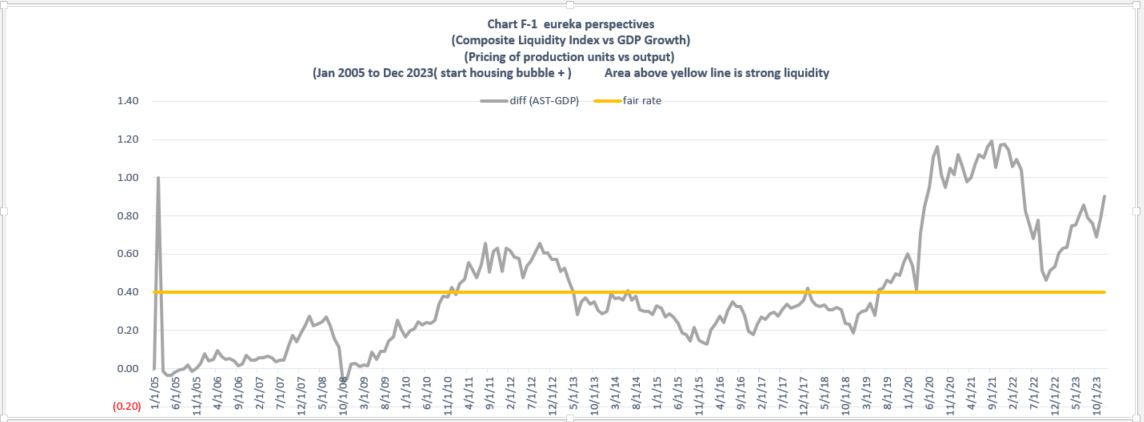
The liquidity index is a composite of values of stocks, bonds, commodities, and precious metals.
Analysis compares the Liquidity Index to GDP output.
What do we see?
- The big picture illustrates that prior to December 2010, the 2005 to 2008 housing buildup, 2008 GFC crash, and then after 2009 the subsequent rebound of the liquidity index.
- December 2010 to May 2013, made the initial Funny Money reaction of the liquidity index stand out.
- May 2013 to June 2019, was a period of settling in, adjusting to less efficient Funny Money activity.
- June 2019 to Covid Crash of March 2020, Funny Money was back on the front burner with addition of liquidity from Trump Tax Cuts.
- March 2020 to February 2022, more Funny Money complements to liquidity by Covid based cash injections were seen.
- February 2022 to December 2023, Liquidity growth based on production efficiencies was strong.
- December 2023 forward, with liquidity index at 0.90, we see a robust liquidity index running into the March 2021 resistance area of 0.98. Things will be ok, but strong upward market moves will be nothing like the 0.46 to 0.90 liquidity index rise seen between October 2022 and December 2023.
Chart F-2 Comparison of Economic Production Factors including Fed Balance Sheet
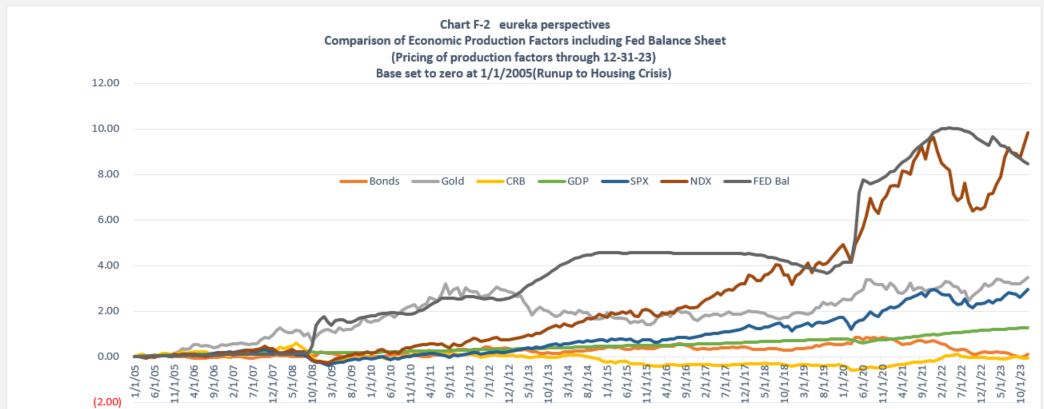
This is the fun chart, where you get to see a picture of many of the moving objects.
- The highlight is probably the relationship of the Fed Balance Sheet index and the NDX (Nasdaq 100) index. These indexes have been tracking fairly closely over time, although activity since October 2022 has been less so, probably because NDX reacted too aggressively to the downside between November 2021 and October 2022 and has had to correct upward, and at this moment over-corrected.
- For the other indexes we see gold and SPX kind of upward together, although gold has seemed to have outperformed during the two hot funny money periods, 1) out of the 2009 market low area and through 2012 and 2) during the Covid cash injection panic period around August 2020.
- GDP during the whole period is kind of the slow and steady upward index.
- Bonds and commodities bring up the bottom rung. Commodities put in a bottom in 2020. Around March 2020 we see a commodity low, and a Bond high. Now bonds are struggling with a macro low. More detail on this in the next chart.
Chart F-2c Comparison of GDP, Bonds, and CRB Commodity Index
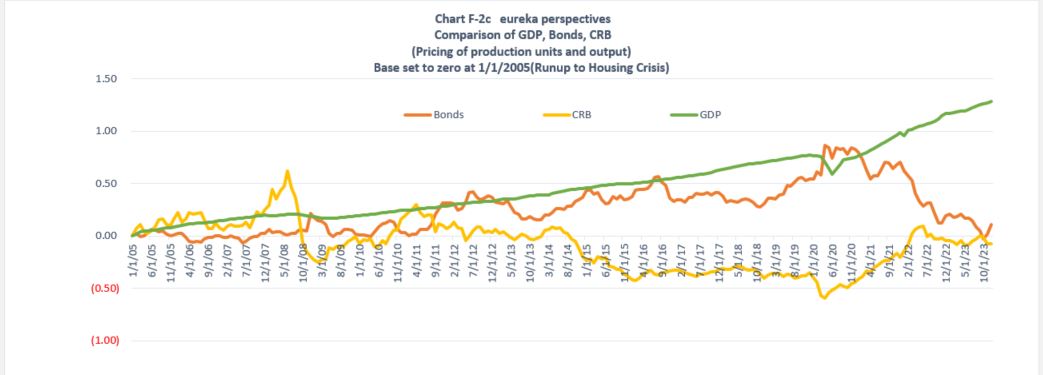
This chart shows the Bond, Commodity and GDP relationships mentioned above in more detail.
- What stands out in this chart is the magnitude of the range between the highs and lows of bonds in the past four years. To me it would seem that this market has everyone exhausted. The “zero” bound Bernanke experiment leaves little on the table to talk about. I suppose the April 2021 Bond price level stands out as an objective for a macro move higher, but the fact remains, there is too much economic growth on the table to allow interest rates to decline very much.
- The other thing that stands out on the chart is the mirror image of commodities to bonds coming out of the March 2020 time period. Commodity prices being dominated by energy prices could be the one bright spot for Bonds. The possibility that the economy has seen the tipping point in energy prices, back in 2016, could be good for bonds. More on that in the next chart.
Chart F-4 Comparison of Energy Index and GDP
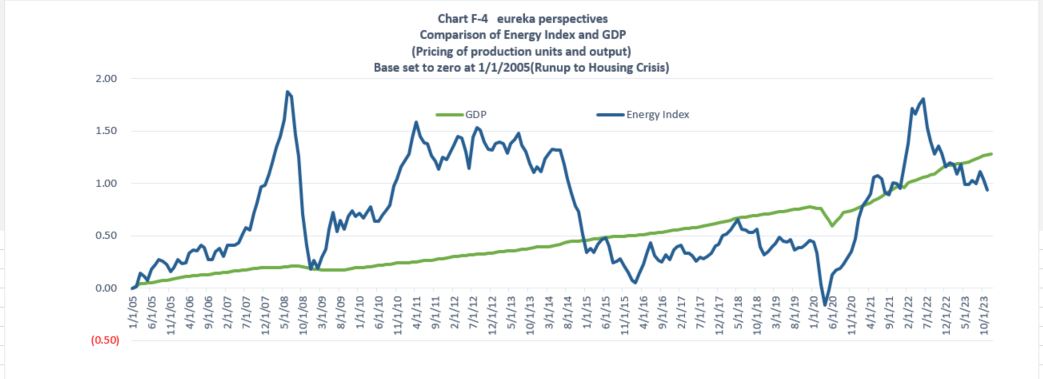
- This chart shows the two peaks in the Energy Index, June of 2008 and June of 2022. The midpoint between those two peaks is June 2015, a point that I refer to as the Tipping Point in Energy prices as the end game period started for effects of the Green Economy on fossil/ethanol/Bio Diesel prices.
IN SUMMARY…
I will try a little wrap-up for the first six months of 2024 here based on the input and analytics shown above.
- S&P prices as a signpost are expected to trade in a range of 4650 to 5150.
- Bond Prices are going to struggle, not going lower, but rally’s will be subdued due to no recession and solid growth demand for money.
- Commodity prices other than energy will have support due to production growth factors, but probably no roaring bull market due to the energy influence. Energy is just in the early stages of a decline so for the first half of the year a $ 65 to $ 85 range on oil can be expected.
- Gold does not have a stimulus factor. Monetary policy will not be conducive to unproductive assets. What will prices then do, probably be soft to declining.
- Bitcoin will be trolling for new suckers with CFTC and SEC approvals helping the game.
- The dollar index should have good support in the 99.0 to 101.0 area with more chance of strength than weakness.
- The biggest input to stability is the fact that Fed monetary policy is trending towards normalization.
////////////////////////////////////////////////////////////////////////////////////////////////////////////////////////
* And now I will close with a macro view of the Climate Change Initiative. It is from a letter that I sent out on 12/19/23.
“Here is a little bit of the theme that I have talked about on my website/blog since mid 2022.
2022 is the new 1942, we saw the start of WWII back then and the base for an 18 year economic boom based off the government investment in the War. This created a high deficit to GDP ratio, and was repaid over the next 18 years by high income tax rates on the high earners. Many of the companies that helped win the war spun around their infrastructure after and the economy took off in 1947 and didn’t look back until the early 60’s.
Now we have a similar setup, the War on climate change is bigger than anything since 1947 based on percent of GDP to win it. More people will die from it, drowning, burning, breathing, etc. So 2027 will be the new 1947 and this economy will keep going into 2040.
Now we in 2022 saw the first investment by the government, this is just a start, and many of the Infrastructure, Solar, EV, Battery, etc companies involved will be the market beneficiaries. This is not the time to own Walmart or Hasbro, or even probably Googl, they are part of the consumer culture which while remaining a big part of the market will not be part of the growth story. Oil, a sector where a lot of investors are currently hiding, is at a tipping point, it may average $ 60 for the next 5 years but is more likely to go to $20 than the $140 by 2030 I hear from the inflation bulls these days.
True, the climate deniers are screaming and taxes are going to go back up on the high earners. Talk of leaving the US by the wealthy will be short lived, as offshore islands will be under water and half of Florida will be abandoned.
Donald L. Knepp“