Second Half 2023 Outlook..
7/29/23
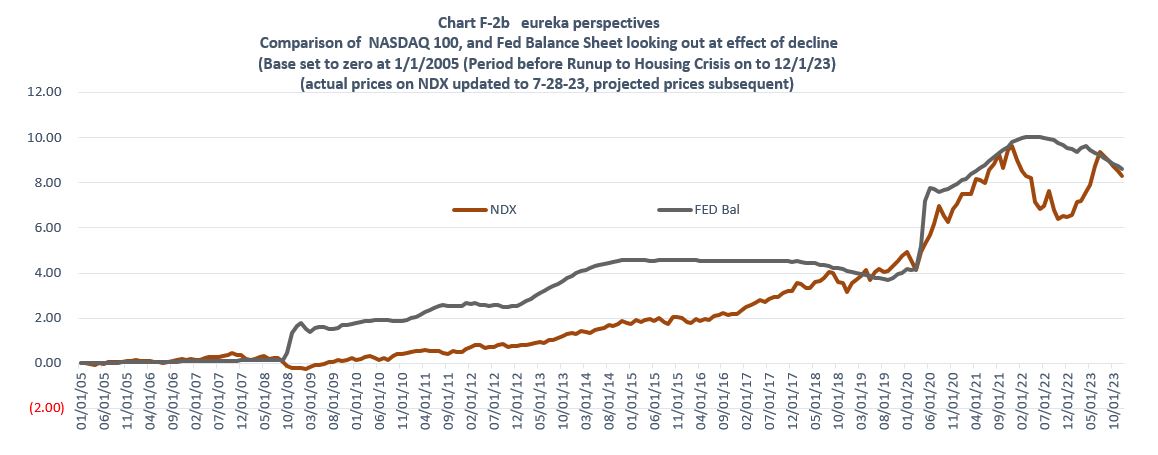
This post is an updated version of yesterday’s post. The post yesterday had actual data through June 30, 2023. This weekend, the data has been updated through July 28, 2023. This update helps to bring in focus what we outlined yesterday as the runup in NDX in the month of July has brought its prices up to the FED Balance Sheet decline line. This means that the anticipated decline in NDX prices will commence from this general area.
Our model continues with its focus on the FED Balance sheet as that will probably be the most important factor for the remainder of the year. The reasoning is simple, we have been watching and measuring the balance sheet against the Nasdaq 100 for a long time, it was a big part of the bullish move starting in 2020 and was part of our bearish call on stocks in late 2021. (the two big points on the chart up to this point were 3/1/2020 and 12/1/2021). Now with the huge runup of NDX and the continuing decline in the balance sheet, the two lines intersected on July 28, 2023. That was not good for tech stocks the last time these lines touched. Following the projected data and price lines, one could expect NDX prices to decline a minimum of 13.5 percent and potentially test June 2022 area between now and the end of the year.
Here is the updated chart:
As outlined yesterday, the rollout of the effects of this FED Balance sheet phenomenon will potentially have big repercussions for interest rates, ie. putting pressure on rates as things unfold. As such we are probably right now looking at the highs for the year for working rates. In a sense the market is set up to get its long forecast FED inspired slump. Down the road another wave of climate problems and the 2024 election cycle will provide another setting in the coming spring.