200 Day Scare…
The last few days we have seen the CNBC guru’s focus on the S&P 500 and the fact that it was trading under the 200-day average. That is true, but how much information does that register as to the Macro market environment? Not much, in my opinion.
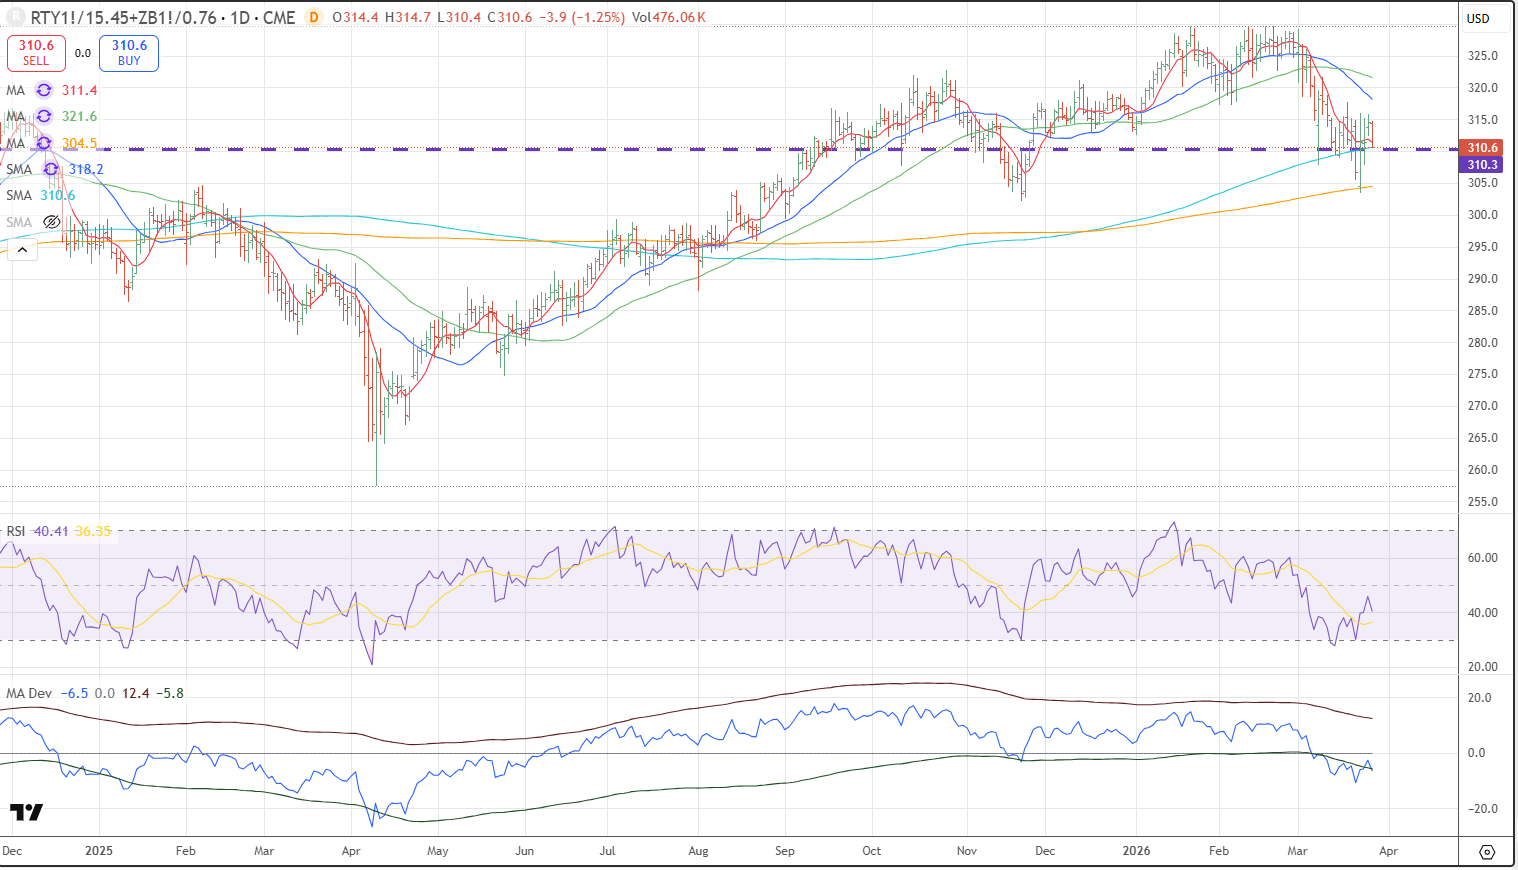
What is more meaningful to me is to use the stock and bond half of our Macro Sentiment Indicator Index. That is the long Russell and long Bond portion. The other half of the equation, the short Gold and Silver portion is part of the bigger sentiment view, and already has done its thing as we pointed out a couple of days ago. That portion is in what I term a neutral zone, I don’t see any reason to be either long or short precious metals after the March 23 levels were hit.
Below is the chart of the Russell and Bond portion of the Macro indicator. The 200 day average (the turquoise line) is holding for it.
Tomorrow being a Friday and Trump being in his period of concocting his Victory speech will probably keep pressure on things. But the bottom-line, is that the S&P 500 is where the scared investors are hiding and as such has more vulnerability to the chaos.
Leave a Reply