It’s Down to Powell and the Big Question.. Recession or Inflation
Today the early trade seems to be a “Jerome Appreciation Celebration” as he appears to have convinced the markets yesterday that valuations don’t matter and all the players have to do is follow his cues. Has this turned into a game, a game with a lot of America involved. I think it has?
The VIX is telling a story.
Many traders follow the VIX in order to see when the market is getting stretched. But in this game since August 2020 the VIX has stayed relatively low, no one seems concerned about risk in the stock market. In fact today it got down to a ridiculously low of 14.73 in early trade.
My take on this phenomena is that the generally low VIX numbers we see are really like when little kids are read a scary fairy tale, and everyone starts holding each other close, not venturing outside by themselves, something bad might happen.
With this market and the big long trade tale, all the traders appear to be holding each other close and not venturing outside the trade, knowing this is not going to end well at some point, but hopefully they will survive. Thus we have a VIX that doesn’t move out of the envelope.
Our Macro Fundamental S&P Hedge Algo is catching the Heat.
The FED stimulus has given our S&P Hedge Model a big pushback. This is a Macro model based primarily on fundamentals with a couple of technical algo’s thrown in for timing purposes. We tested the model for the period prior to 1/26/18, the point where Trump’s Tariff Wars and Corp Tax cuts set the market into turmoil.
The Model subsequently had some large gains including short positions through the Covid Crash and then subsequent a long signal initiated on March 9, 2020. Everything started to unravel with a short signal on August 27, 2020. That signal has not been negated and currently has 64 units of S&P with an average trade price of 4043. (Once a short signal is in place the model adds one unit on any day when the daily RSI is over 66.0, likewise on a Long Signal it adds one unit on any day the RSI is below 33.0).
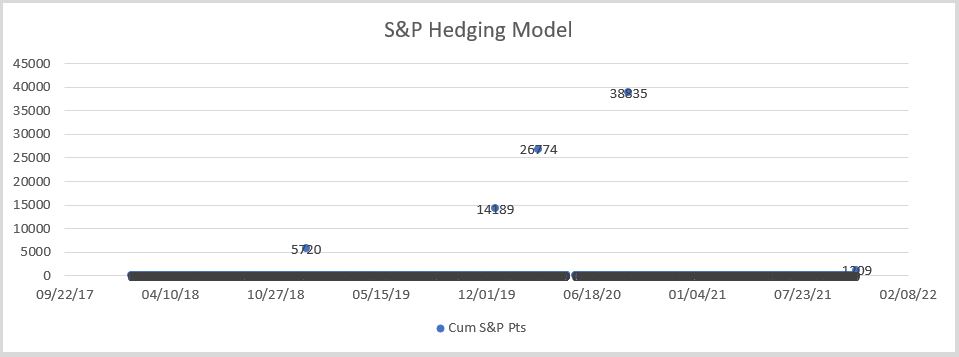
Here is a crude chart of the trading P&L for the S&P Hedging Model.
Signals since 1/26/18 are:
Short 1/26/18,
Long 12/24/18,
Short 12/18/19,
Long 3/9/20,
Short 8/27/20,
On this chart below you can see that over 33000 S&P points at the peak in August 2020 have dwindled down to breakeven today. Yes we had big profits at one time but it is remarkable at the loss in the open short trade since. With the RSI over 66.0 today we are adding another unit of short S&P. This brings our average sale up to 4052 and when the market gets down to that level and headed much lower, we will have recouped the losses in the short trade and have the prior closed profits on the books. The fact that this is a combination of a manipulated market and a scared player community means we will ride it out because neither Recession or Inflation will be good for the markets.
This morning a rather strange trade was pulled off. The HYG junk bonds had a huge rally early and have subsequently pulled back most of it. Who did that? Watching.
Leave a Reply