Flirting with the 200 Day Average
The Yield Curve continues to drive the action, the market is still buying the inflation/growth story and that is not good for stocks. So far the 200 day average on the S&P is providing a defense, but that will probably give way and once the 3 day average goes under the 200 day on a closing basis, the action will accelerate. At the moment the 200 day is at 2611 and market is at 2614.
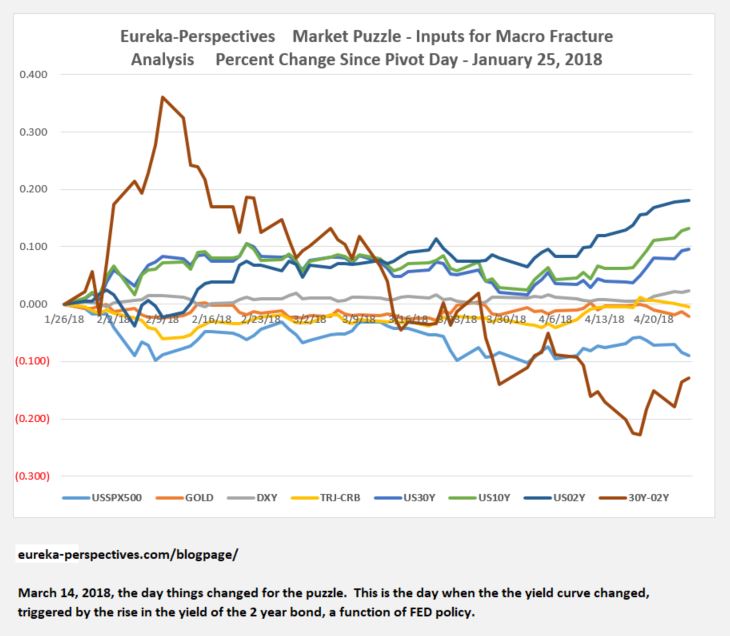
So to review:
- We are short stocks,
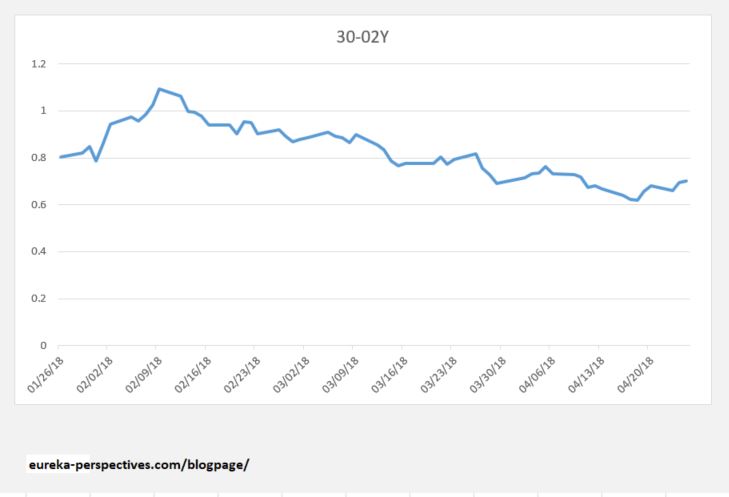
- We are long 30 yr bonds, short 2 year bonds,
- We are short commodities, although this is a very early stage to this move as outside forces are holding things together for the moment in oil and aluminum.
- We are long gold, but again this is a fear trade, something to keep in your back pocket.
Here are the charts through 10:00 AM CDT
There has been a little backup in the yield curve the past couple of days but the March 14 breakout still holds.
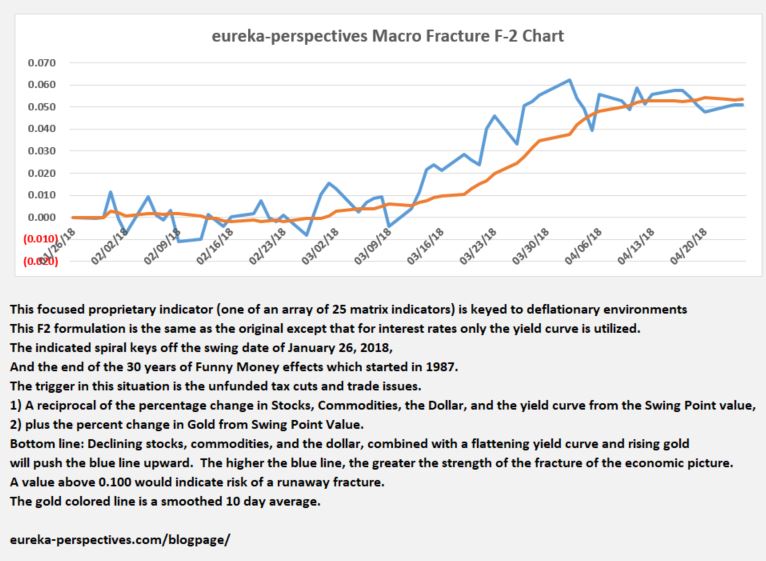
The Fracture line would appear to us to be staging for its upward breakout.
What i do not understood is in reality how you”re now not actually a lot more neatly-favored than you might be now.You are very intelligent. You realize thus considerably in terms of this subject, produced me in my view consider it from so many various angles.Its like women and men are not interested until it”s one thing to do with Lady gaga! Your own stuffs excellent. Always take car of it up!my homepage magic breakout mt4