Both Down? With Update at 11:00 AM CDT
I always find it instructive to watch for what the market commentators downplay. This week most of the attention has been focused on the FANG stocks, especially Facebook and Amazon.
What have not heard much about is and what we find to be important is the fact that long term interest rates and stocks in general are Both lower this week. For a long time whenever interest rates went down, stocks have gone up.
The Market Puzzle and the Fracture
Take a look our two charts that are tracking this scenario, what we call the “Fracture” where things work differently from what has been happening.
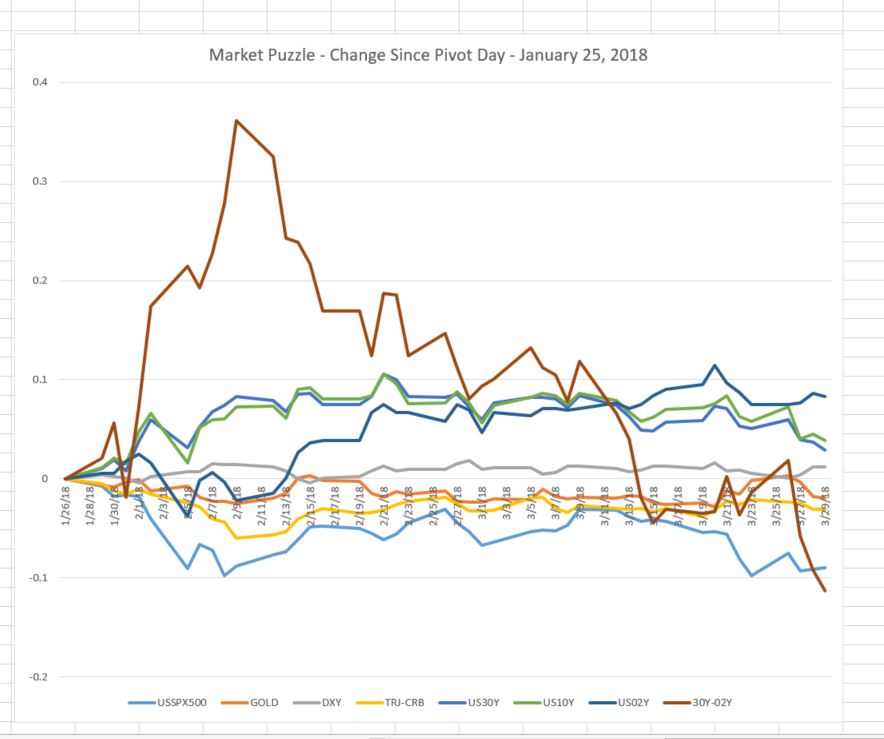
First the Market Puzzle chart tracks the percent change on key factors based on the Swing Point day 1/25/18. Data as of 9:35 AM CDT
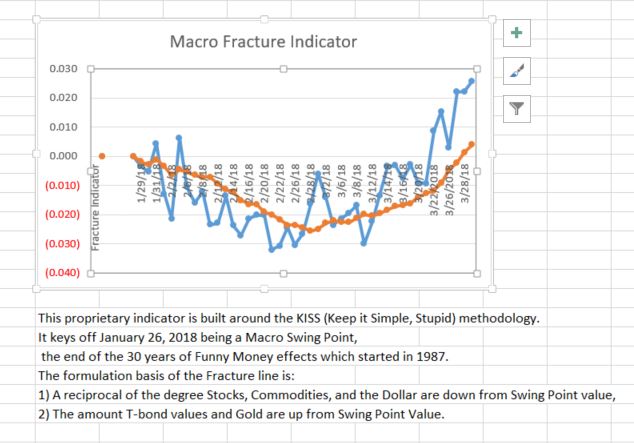
Next we take a look at the Macro Fracture Indicator, we would view the chart to indicate direction but no breakout yet. A number around 0.100 on the Blue line would be more what it would take for that breakout, a run up on Gold or run down on Stocks would activate the breakout.
Update at 11:00 AM
The Atlanta GDPNOW for the first quarter numbers came out this morning (we use Atlanta rather than New York as the New York model seems to be more of a PR presentation rather than pure calculation), anyway the results follow along with our idea that inventories are building and consumption is weak. The market puzzle numbers as applied to the Fracture Model are not really changing this morning as the stock rally numbers are being offset by interest rate declines.
Leave a Reply