Strategy Time…
This is a week to patiently settle in, maybe add to positions, but keep the power for the breakout. The lows were made on April 7, now we are seeing another retest, a little like what we saw last week. This will continue until we see a close over 5513 on the SPX. Importantly the RUT / NDQ ratio has popped up to 0.1038 for last week’s low of 0.990.
First, below is a repost of an earlier blog. We are now out a little over three months from this posting on January 10th. The Reset part of the scenario played out a little differently than expected, but did reach the expected 5300 S&P level. My view of the next step in the trajectory remains in place. Timing has been stretched out some but next up in my view is the Trump Upward Manipulation phase which will have a lies basis. Here is the original post:
_______________________________________________________________________________________________________
Trump has No Clue…
Eureka Perspectives January 10, 2025
As the S&P market heads down towards the 5300 level that we mentioned back on December 19, it is becoming more apparent to more people that the coming Trump administration has No Clue on how to keep the Bidenomics Rally going and probably more importantly, why it worked. But that is where we are headed, the Reset first, then the Upward Manipulation, then the Crash which will be a factor of depression level growth. The 2025 Projections that we presented earlier this week illustrates the kind of volatility that we see for the next year and more.
_________________________________________________________________________________________________________
The 2025 Outlook projections that I posted on January 7 are on the website for your review.
The Macro Model includes these elements.
- Aggregate Macro Input/Demand Creation Factors.
- A) GDP output
- B) Money Supply
- C) Fed Balance Sheet
- D) Fiscal deficit/credit figures
- E) Consumer Confidence
- Output Multiplier Factors are then plugged into the model.
- Next Price Index Projections are calculated.
- A) S&P Prices (SPX)
- B) Nasdaq 100 Prices (NDX)
- C) Bond Prices (TLT)
- D) Gold Prices (GLD)
- E) Commodity Prices (CRB)
I will update the 2025 model projections for the coming periods in the next couple of weeks, as soon as first Quarter GDP numbers are released by the FED. At the moment the GDPNow data show a negative number for the first quarter.
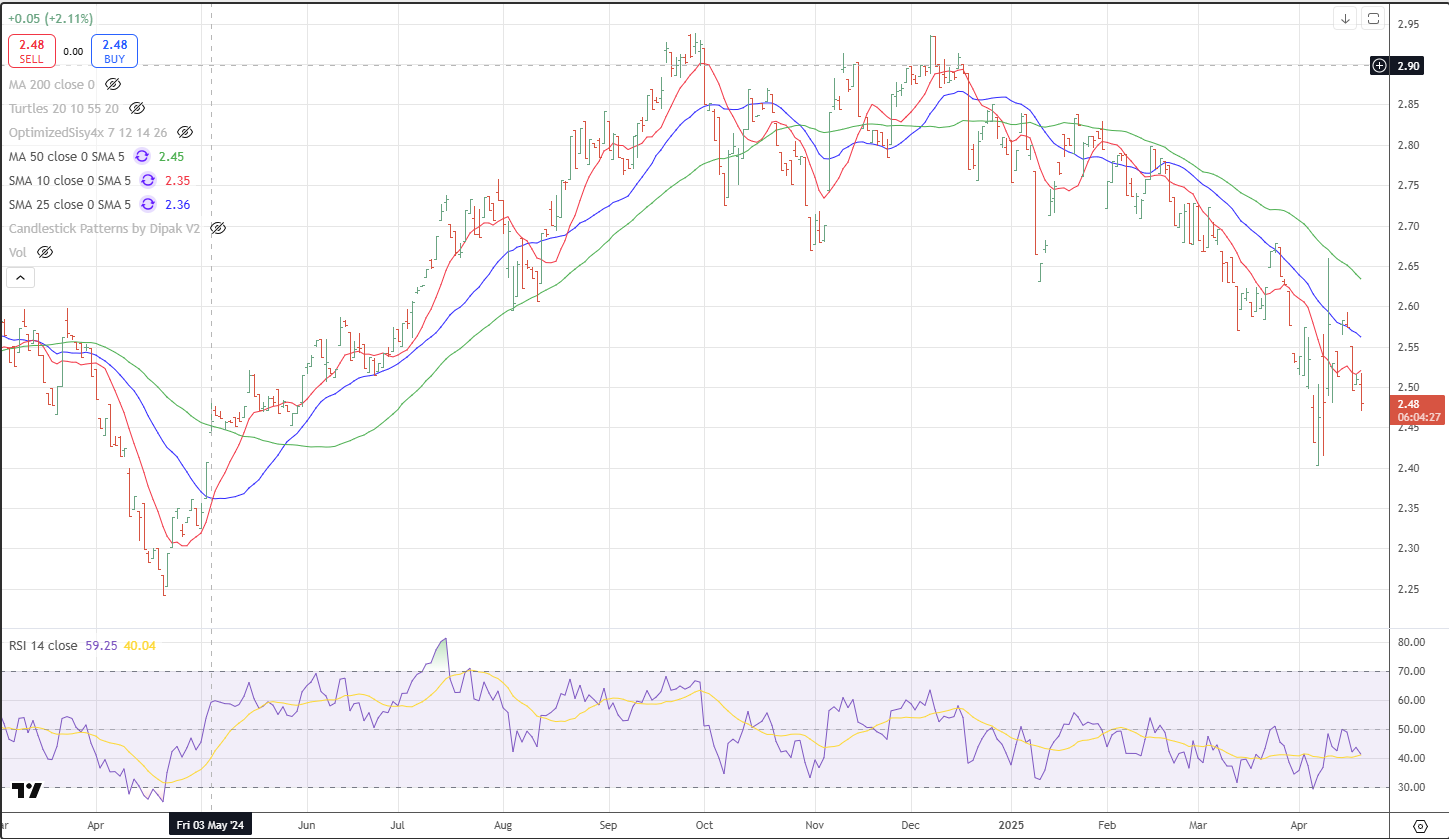
One thing we do know is that the Multiplier we use to project prices based on fundamentals has to date had a major decline to 2.40 last week, down from the December reading of 2.94, today it backing off a bit from last week’s bounce high of 2.55, now to 2.48. This is based on our interactive market-based Multiplier algo that we monitor continually daily for use in our daily trading comments. See daily multiplier chart here.
Leave a Reply