The Long Tail of Funny Money…
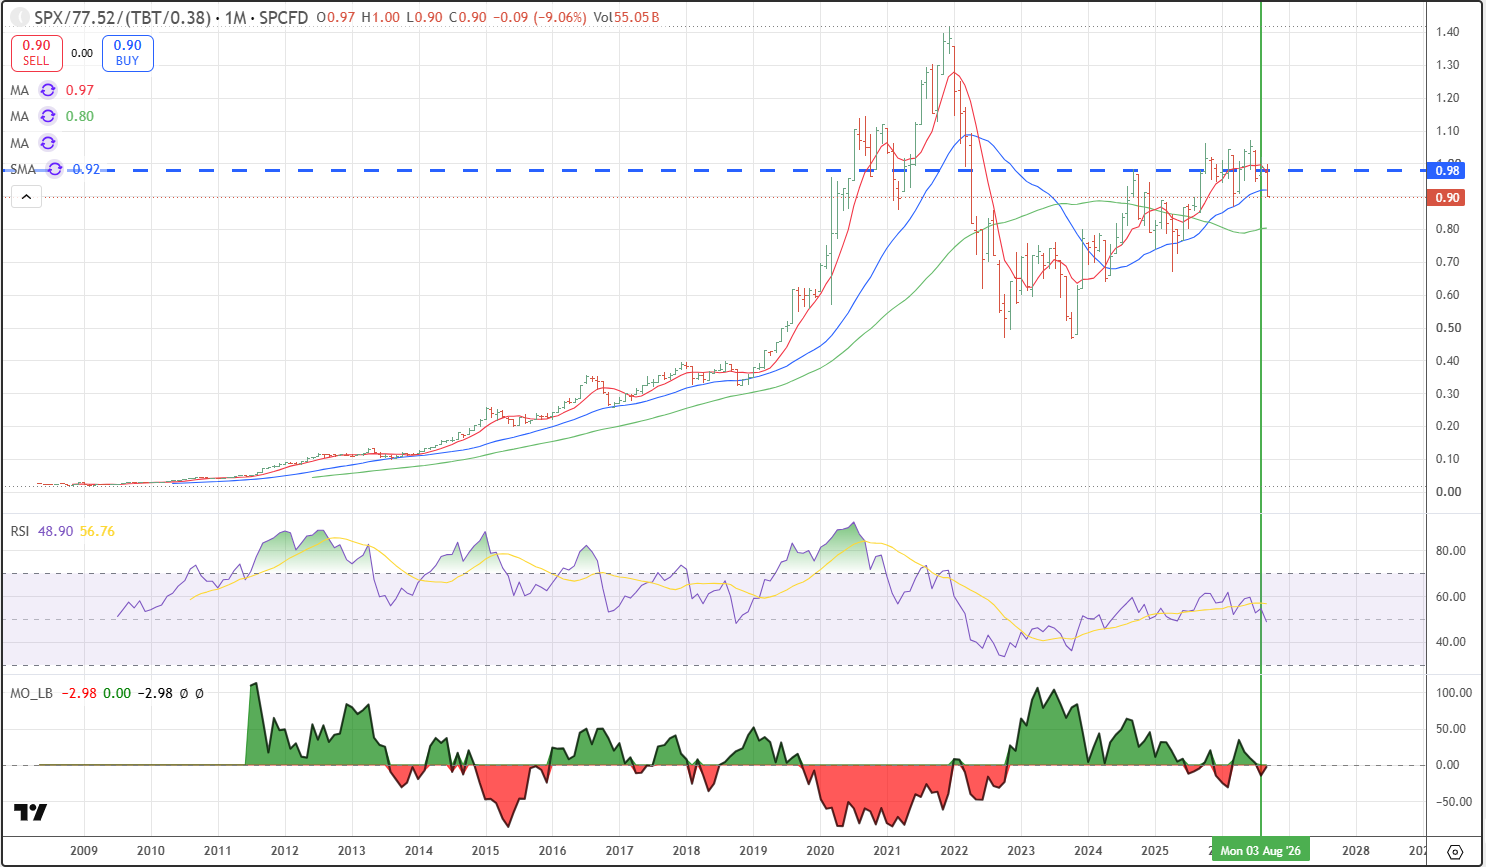
What we are witnessing since August 3rd, has been a long time coming. I am posting a chart here of an index I created, SPX (the S&P 500 ) divided by TBT (the short bond ETF) starting in 2008. What you see using monthly data in this relationship is a continued ramp up of the S&P vs short bonds as Bernanke and his followers compounded QE from October 2011 into the Pandemic High of December 2021, ten years of craziness.
Then through Powell’s half-hearted attack on transitory inflation, the S&P cracked versus short bonds. That didn’t last long as the underlying political approach to financial matters kept adding more debt and this relationship bottomed in October 2022. By September 2025, a year ago, and three years after the short-term bottom in the relationship the S&P could not sustain a rally against short bonds, it had hit a barrier, and what we have seen is a year of treading water in the relationship as Trump has added debt and the AI sector tried to offset the paradigm with more spending, masquerading as GDP.
Then In August 2026, the Bond Vigilante’s took a stand. Treasury Secretary Bessent is fighting them but he is treading on quicksand. This week we are seeing a crack of this long S&P / short Bonds relationship, as being short Bonds starts to be more profitable than being long S&P, or apparently any stocks including AI related ones. The Green vertical line is for August 3rd, 2026, the day the Bond Vigilante’s took control. At this point in the long S&P and Short Bond relationship, the Bonds have made their point, they have embedded higher rates in the system, the action now will be in the reckoning of the S&P and other stocks.
Leave a Reply