Big…
Today has the makings of an important day in market history. I frequently mention two indexes that we calculate and monitor. One is the Monetary Multiplier Index, it is the sum total of the impact of the Dollar, Gold, Oil, 30-05 Yield Curve and the 2 year Interest rate. The other is the Market Multiplier Index, what we label “Animal Spirits”
My overall approach to the markets during this “Trump Frenzy” period of history can be reviewed by reading the blogs posted in the front page Archive section of my Blog for the dates in 2025-2026, October 28, April 23, April 24, April 25, April 28, May 5. The two big takeaways from all those posts are melt up market manipulation and a S&P target of 9600.
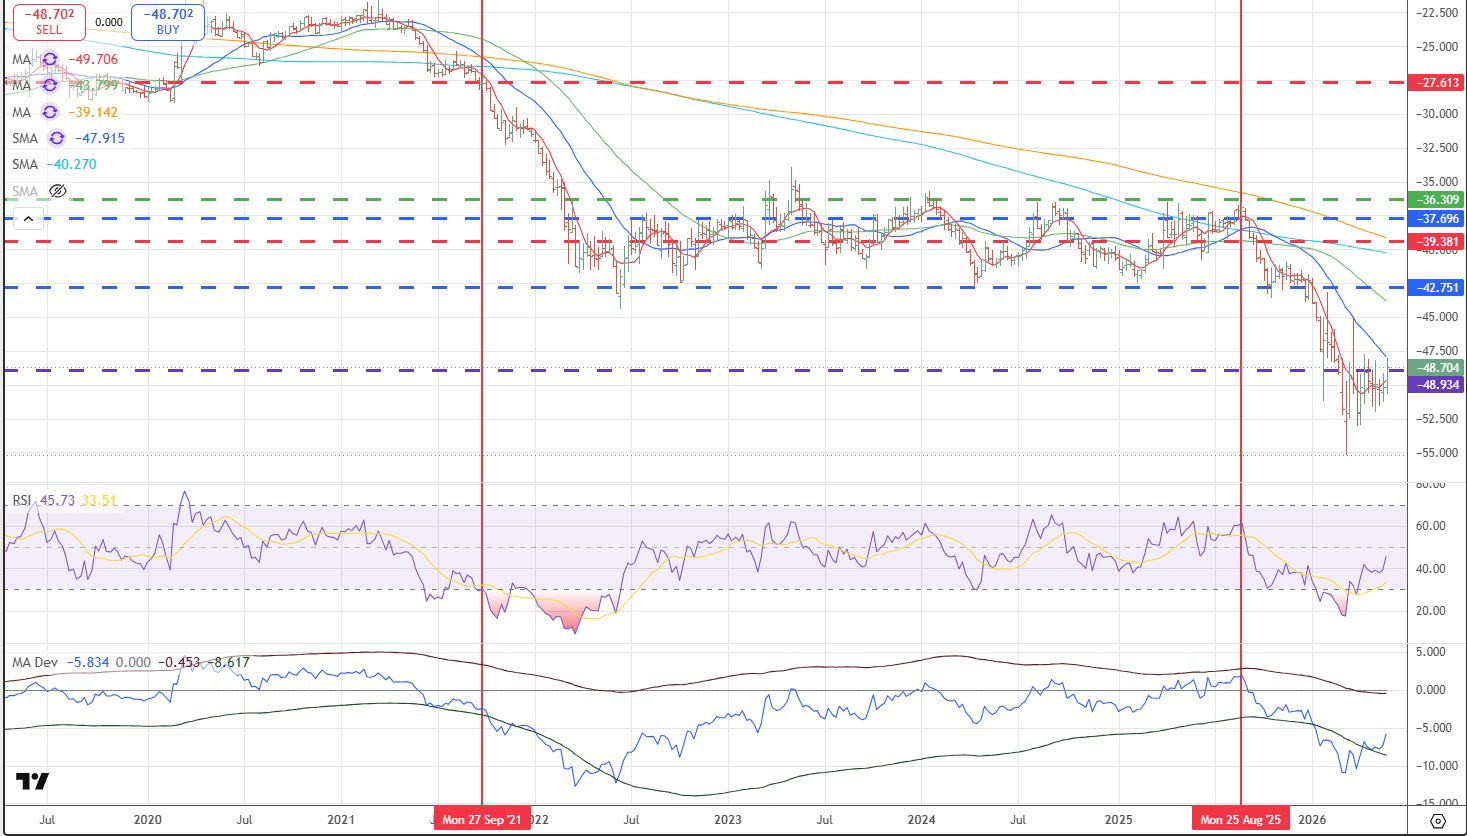
Here is the chart of the Monetary Multiplier using weekly data through today. In the past twelve months it peaked during the week of August 25th and bottomed during the week of March 9th. Today it is making an attempt to break out of the bottom area. The biggest positive driver out of the bottom area is declining gold prices, while the biggest negative has been a declining yield curve, i.e. flattening.
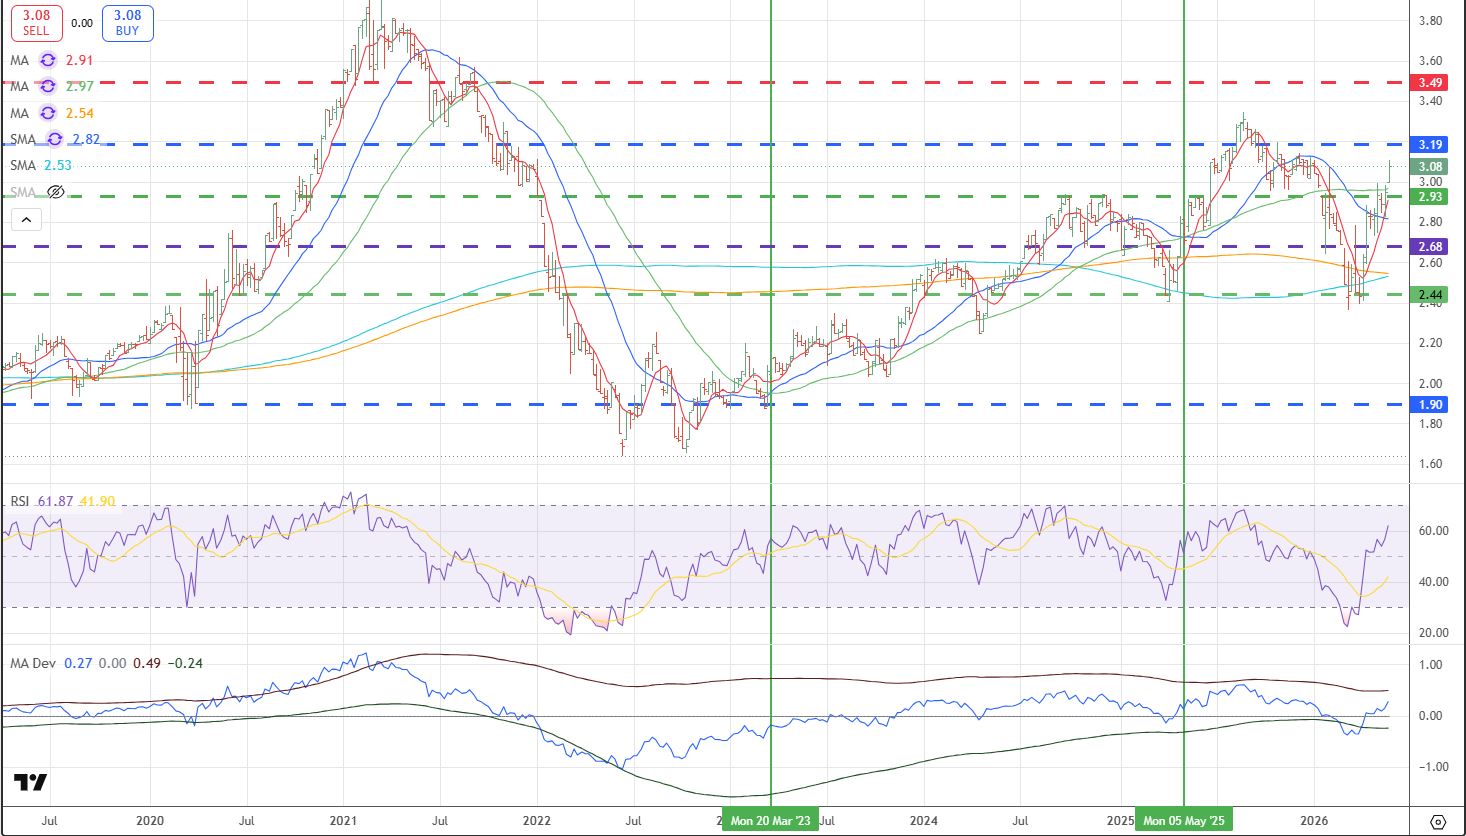
And here is the “Animal Spirits” chart, again using weekly data. Since the Covid high during the week of February 21, 2021, we saw a low on June 13, 2022. Since then we saw a climb into the pivotal August 2025 high. What is interesting is that August 2025 marked the high for both the Monetary and Market Multipliers while March 2026 marked the low for both. That is due to the fact that Gold has been by far the biggest driver. Rising gold is negative while declining gold is positive for the stock market. What may be even more interesting is that the Gold market seems to be much more attuned to macro factors. All the people looking for the top in stocks should probably be watching Gold. To me the level where Gold may make the next macro bottom is in the 2100 area.
Leave a Reply