Market is Wrapped up in Cross Currents…
Today as the market got an inflation pass with a PPI number that it can live with, it finds itself in an atmosphere that has had its enthusiasm drained.
Lets take a look at our two index indicators with which we predicate our market evaluation analysis. These were developed inhouse over the past five years, during the pandemic doldrums.
The first chart is the Monetary Multiplier Index which is made up of five data streams that can be followed minute by minute although the weekly subset is more important except for turning points. I will repeat what these five data streams are starting with the most influential and moving down to the least influential. Here we are talking about monetary factors that affect market trade direction. Earnings are outside of this calculation.
- Price of Gold (rising gold is a negative, declining gold is a positive)
- Value of Dollar, (rising dollar is a negative, declining dollar is a positive)
- Price of Oil (rising oil price is a negative, declining oil price is a positive)
- 30 to 5 year Yield curve (declining YC is a negative, rising YC is a positive)
- 2 year interest rate (rising interest rate is a negative, declining interest rate is a positive)
By viewing the five factors it is easy to see what is moving the stock market. On the positive side, the dollar is the biggest factor with oil, YC, and the 2 yr adding to the mix.
On the negative side there is one thing, the bearishness imparted by rising gold. It overwhelms everything and one could say rightly so with the chaos in Washington. It even almost overwhelms the outsized impact of the supposedly bullish fundamental AI story.
The second chart is the Market Multiplier Index, our name for the “animal spirits” factor. It is the “total picture calculation” as it combines all the factors of the Monetary Multiplier Index with the Market Output Index (SPX+NDQ+RUT). It is what measures the market difference between monetary factors and stock prices.
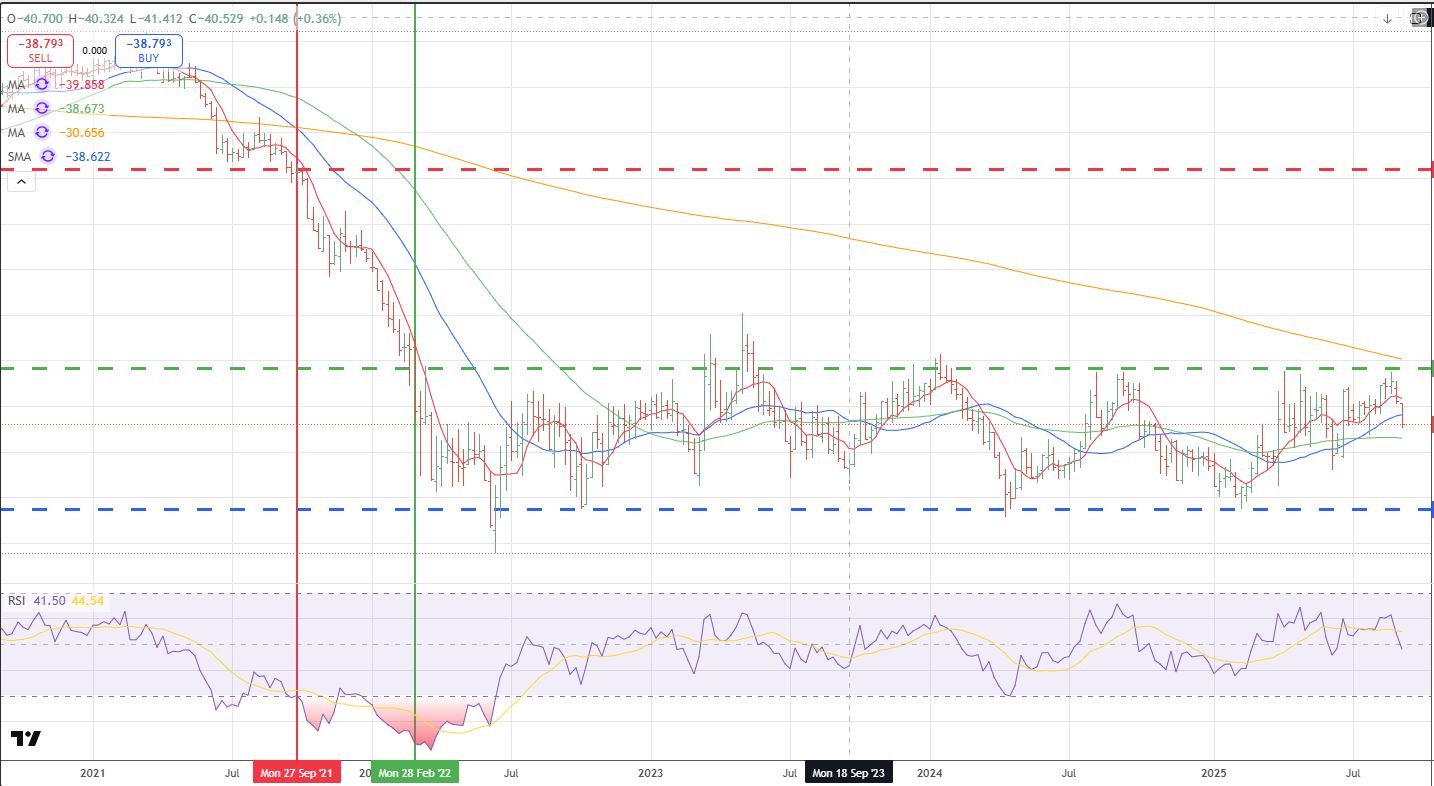
First, here is the Monetary Multiplier Index chart using weekly data going back to 2020. What jumps out to me is the channel that has developed after the FED interest rate rise in 2021, basically the tight channel of the index since February 2022, see green resistance line. The stock market has two problems with this chart, one being that it seems to think that interest rates are the major factor in the base for stock prices, they are not. As stated previously rising gold, a reflection of chaos in Washington plus almost a total market support network based on the concept of AI are the big negatives. That is not to say that some combination of factors will break this chart out to the upside. It will probably be triggered by a decline in interest rates coupled with long gold hedges being dumped. We are watching for that breakout and the possibility of a quick blow-off move to over 8000 on the S&P.
Next is the Market Multiplier Index, i.e. the animal spirits measure. Again using weekly data.
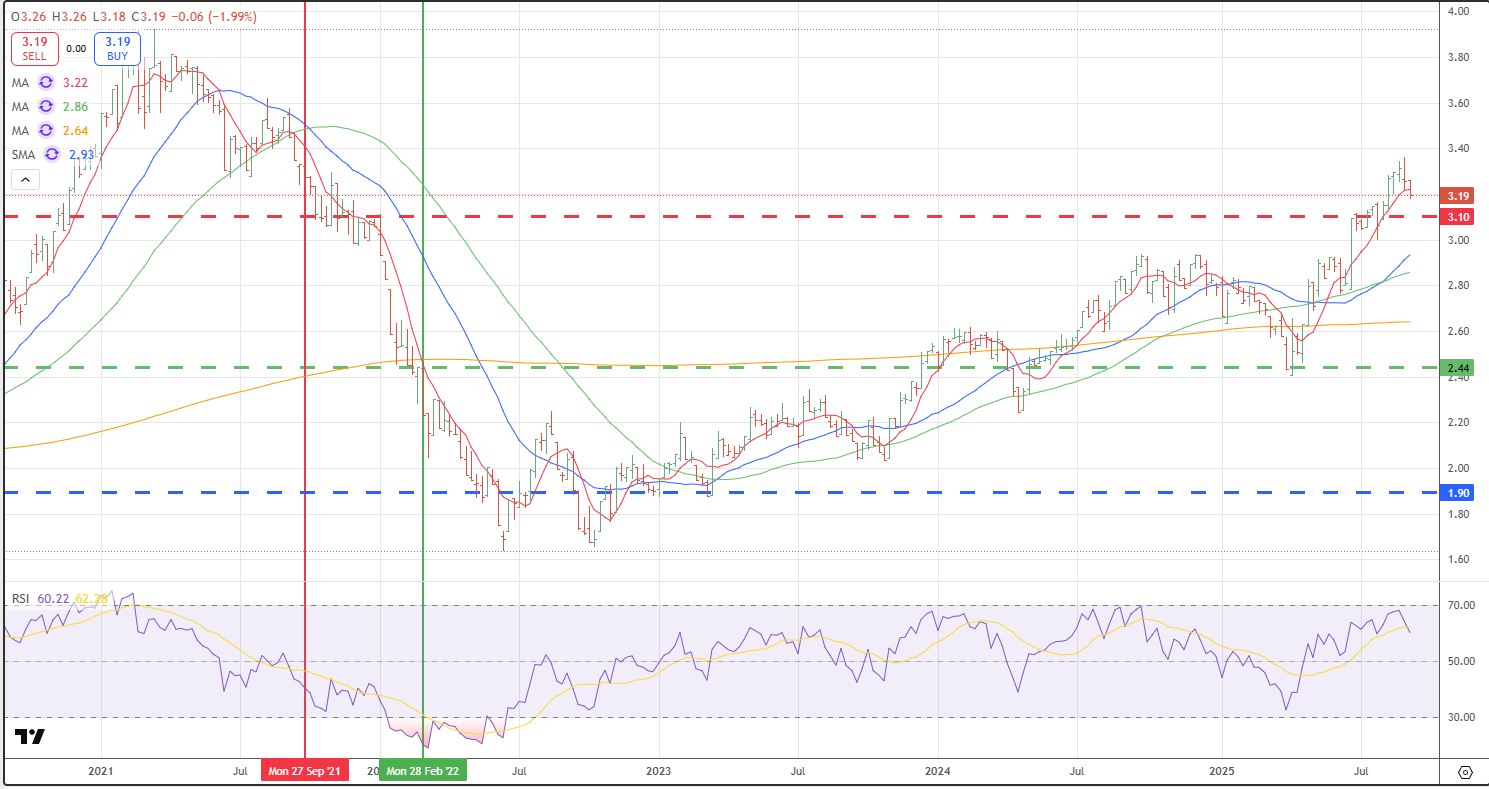
What you see here is the real characterization of the mentality of market players. Since the FED finished its moves in February 2022 this index made a couble bottom in June and October 2022 and has not looked back to review its mental status. It is still in 2021 Bull Mode. Regardless of who was President or what is happening in the world, AI has been the backdoor fundamental driver. Interestingly this index peaked at 3.92 in March of 2021, way before the market high in January 2022. So this index is more a reflection of how in or out of step traders are with the market, not a market timing tool. At the moment this index seems to be having some indigestion after breaking through a resistance line at 3.10 on July 15. The high since was made on August 27th at 3.35.
I do note that we are still way below the 3.92 all time high of this index. At the moment we are sitting at 3.19, down about 5 percent from the high. To me this seems to indicate a certain tepid cautioness on the part of market players.
Leave a Reply