A look at the Technicals…
I had a reader ask a question as to why I do not talk much about market technicals, favoring fundamental and political factors. So first I would say, that yes it is true that I do not follow technicals as closely as many traders do. It is probably due to the research I did back in the 80’s that started with having programmers code in some 300 different technical indicators and programs and testing them back to the early 1900’s. So, my cynicism is probably due to watching the technicals make money for an extended period of time and then not make money for a period of time with no logical reason for that to occur.
We handle that dilemma by developing a baseline technical program for S&P. We use it is to compare its running performance to a buy and hold S&P position. I find the S&P to be much different than commodities as the S&P market is not really a supply/demand equation. The S&P is a government and Wall Street sponsored entity that goes up most of the time historically. There are times when the S&P goes down and I have to admit that my 50+ years in the markets have given way too much energy in trying to determine when those downs will occur. I do think we are near one of those times when this will happen, probably even a bigger crash event than in 2008-2009 Great Recession, and while the overbought technicals are flashing red now, I don’t see the kind of trader euphoria that one sees at the apex. Part of this is no doubt due to the current Macro Crypto Influence where buying and holding over-valued or no value positions is contagious and widespread.
Here are two charts illustrating the comparison performance of the Macro Technical program to a buy and Hold S&P position.
It is probably important that both ways of measuring performance during the period that I am showing, 2017-2025, are strongly positive i.e. the S&P market has been strongly upward during this political period, Trump/Biden/Trump and whether one used technicals or buy and hold, you made a lot of money during this 8 year period.
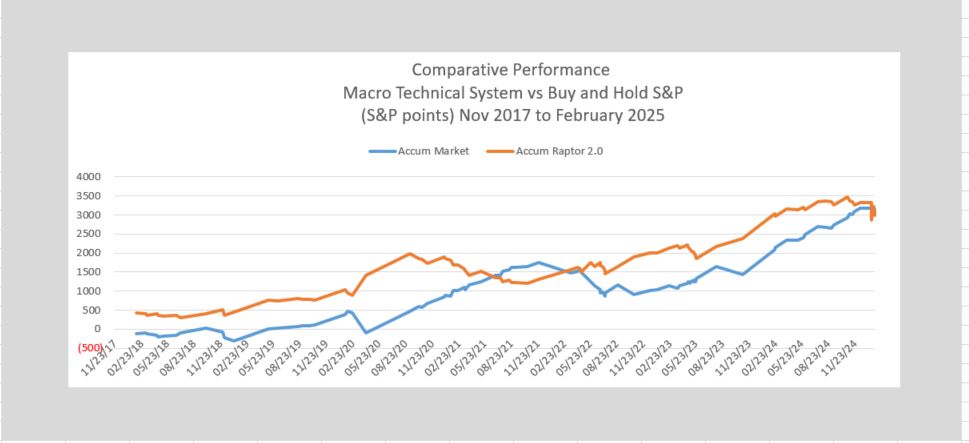
The above chart has some points worth discussing, the first being that in a market that just keeps going higher there is not much to say between using buy and hold trading and technically trading. Obviously if we went back and dug up the comparison for the period 1995 to 2012, one would see a much different picture, with technical analysis far out-performing buy and hold.
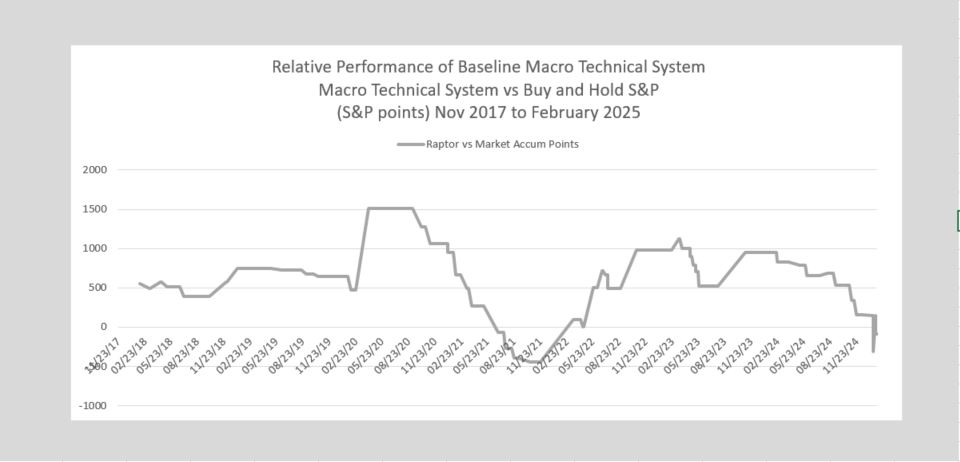
So for me the value at the moment is based on relative performance numbers. What we see is a few periods of interest:
- February 23, 2020 to April 9, 2020, the S&P declined 521 points, 2 months, and the Technicals outperformed Buy and Hold.
- April 9, 2020 to Nov 28, 2021, the S&P rose 1844 points over 19 months, Technicals underperformed Buy and Hold.
- Nov 28, 2021 to Mar 22, 2023, the S&P declined 670 points over 16 months, Technicals outperformed. Buy and Hold.
- Mar 22, 2023 to Feb 5, 2025, the S&P rose 2100 points, 23 months to date, Technicals have underperformed Buy and Hold, current technical position is short with a loss.
Here is what stands out to me at this juncture, the underperformance of Technicals over the past 23 months point to a looming Crash where Technicals will far outperform Buy and Hold. But just be patient, and let the first 100 days of Trump Shock and Awe push the markets into the stupid area. First quarter earnings in April will be important to monitor or maybe anticipate.
Leave a Reply