Market Valuation…
Back in mid September we showed our Macro Valuation Measure, part of our Climate Change Model. It incorporates the dollar, 2yr rate, 30-05 YC, gold, oil, and obviously stock prices.
Here are the Reviewing chart time frames:
1) Extreme Over valuation 11/9/20 to 1/3/22
2) Over valuation & declining 1/4/22 to 2/7/22
3) Under valuation 2/8/22 to 4/11/22
4) Extreme under valuation 4/12/22 to 10/23/23
5) Under valuation & rising 10/24/23 to 6/24/24
6) Over valuation & rising 7/1/24 to 9/18/24
7) Extreme over valuation 9/19/24 to 10/6/24
8) Breakdown into Over valuation 10/07/24
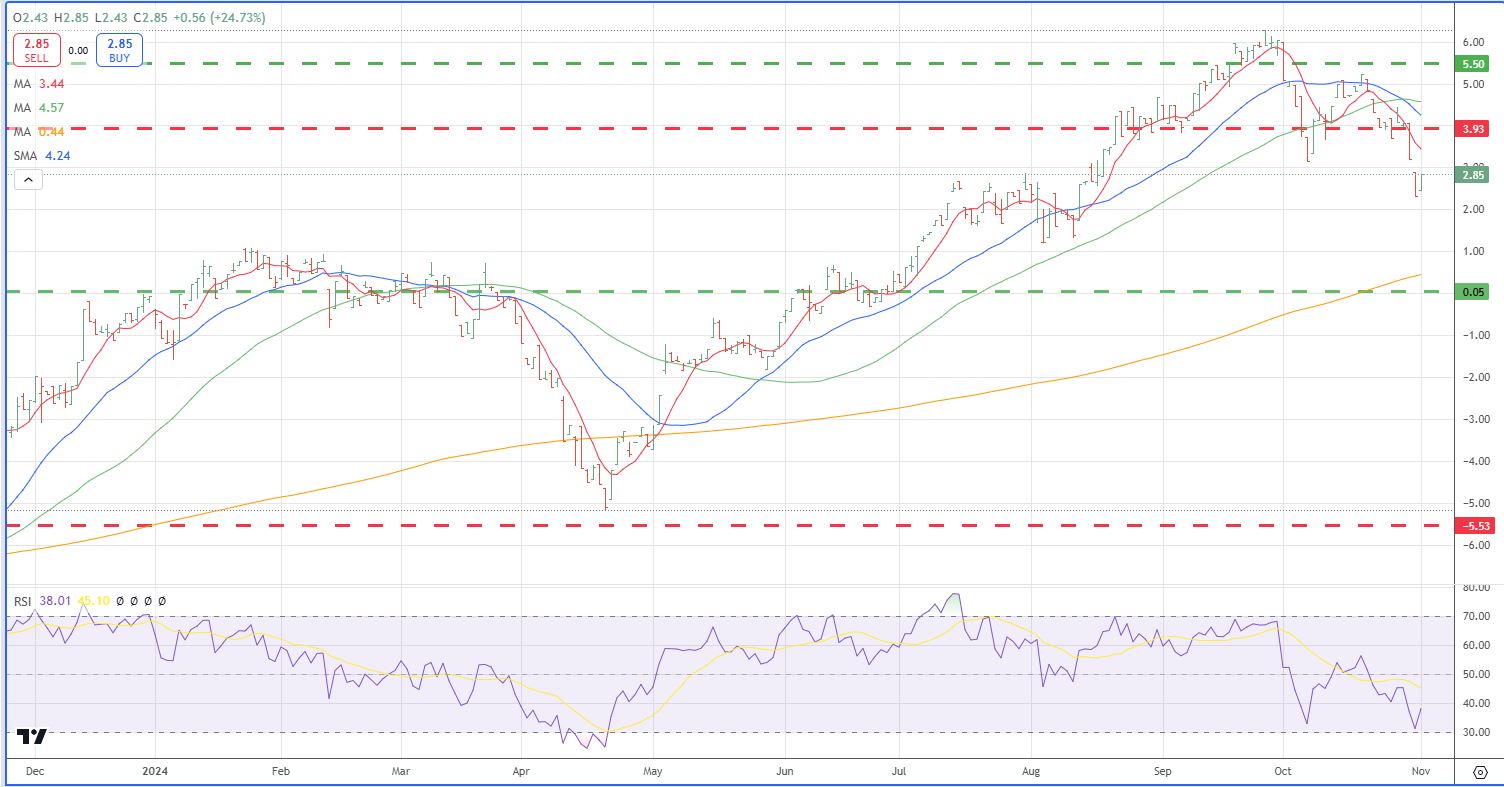
To review, extreme overvaluation starts with values over 5.50. On 9/27 it hit 6.27, then started the adjustment process. At the moment it is on a path downward towards neutral at 0.0, low at 2.28 yesterday, 2.71 at this moment.
Value investors will wait for 0.00 value level to be hit before coming back into market. That level was last seen on 6/27. The shock of a Harris victory to Wall Street could be a catalyst for a move to neutral.
Leave a Reply