Explosive Rally Signaled.. with update
Here are the two charts we mentioned last week, the 2 YR vs 3 Mon yield curve chart, with the FED pushing up the 3 month overnight to the point it may go over the 2 year rate, the FED is up against the wall. This in the past has signaled large stock market rallys.
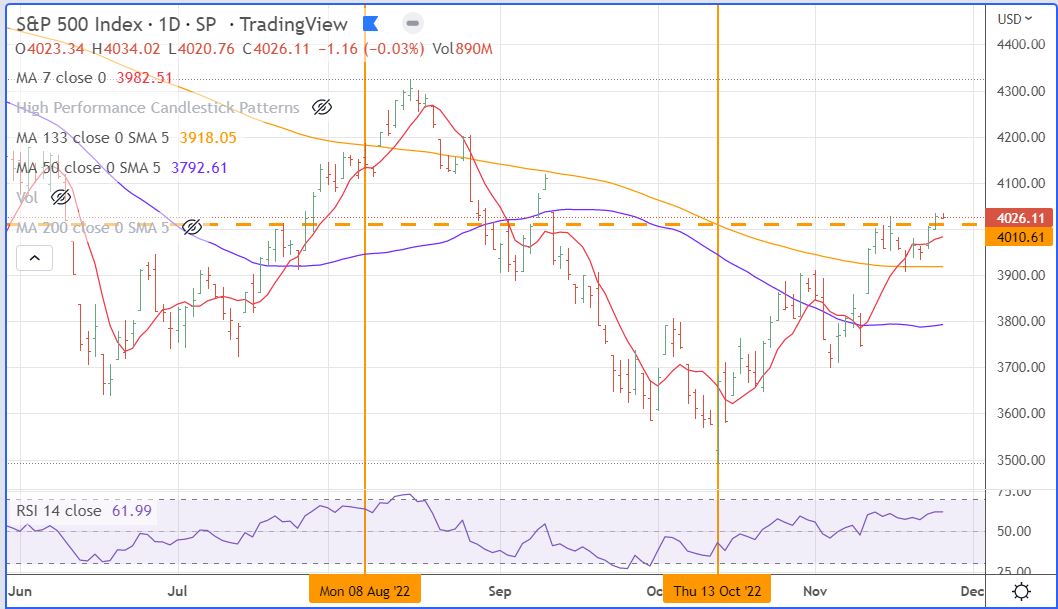
Two areas of activity surrounding the dates of 8/8/22 and 10/14/22 are important junctures, the yield curve sets up a period of rising and the SPX sets up a period of falling. The opposite setup occurs around October 14. See charts

2:00 Update… The markets appear to be choosing to ignore what is going on with rates, preferring to decide that it means a recession is looming. I like to think that “this time will be different” , will talk about all of this tomorrow. So, for the remaining portion of the week we will be waiting for the employment number, which I think will be decent, not too high or too low, just your basic growth number. The market thinks it will be a weak number, which may cause a few convulsions before we take off. The exposure back-off level could be as low as 3820 on SPX, so I am reducing my leverage this afternoon to normal levels.
Leave a Reply