When the FED is Pushing on a String..
Here is something that I have been noticing as I watch the FED try to unravel its mistake and it reveals itself in the yield curve differential between the 2 year rate and the 3 mon FED funds rate. As we all know the FED is trying to divorce itself from economics and use a blunt instrument, the FED FUNDS rate, to try to get control back.
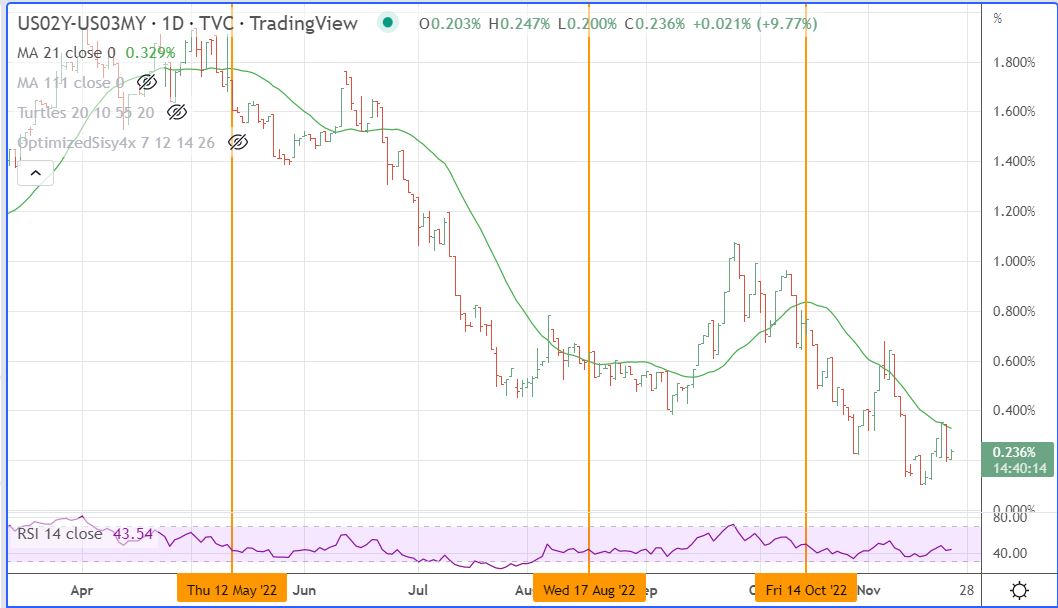
With that one can look at how the 2 year rate is acting versus the FED Funds rate. When the 2 year lags the movement in the FED Fund rate I view it as a situation where the FED is pushing on a string, and vice versa when the 2 year moves more than the 3 mo rate. On that basis I see three important dates in this relationship, May 11, 2022 when the 2 year started lagging the 3 mon rate, August 17, 2022 when the 2 year started leading the 3 mon rate, and October 14, 2022 when again the 2 year movement lagged the 3 mon rate.
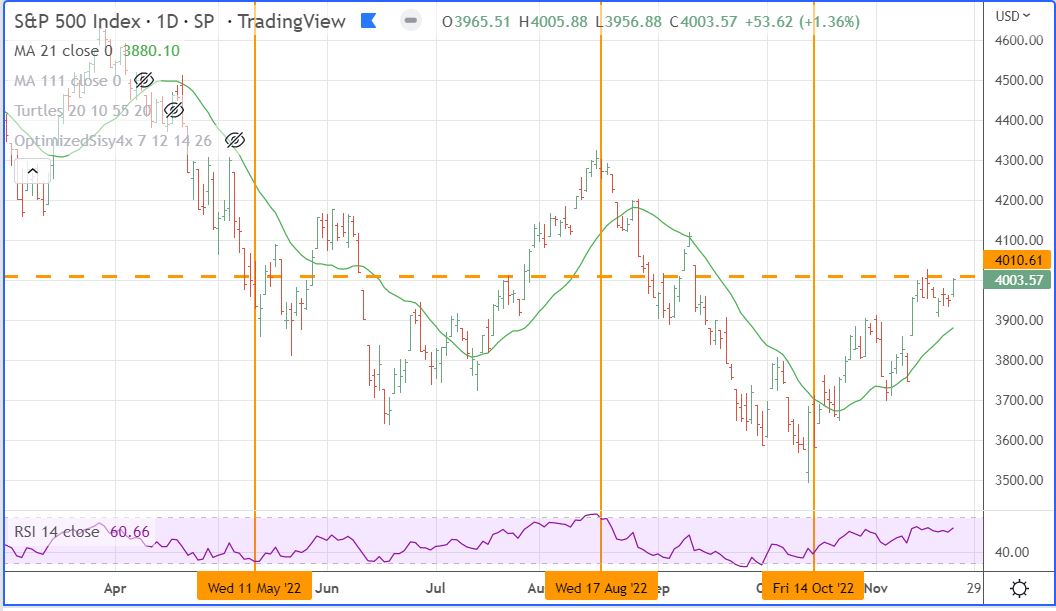
I will post two charts with these dates highlighted in gold vertical lines. The first chart is the 2yr vs the 3 mon rate and the second chart is the S&P. You will note that during the period when the 2 year lags the 3 mon, the FED is pushing on a string and the S&P trends higher. I watch the 21 day moving average in this analysis. The correlations are not precise, but they do provide a good perspective.
Have a great Thanksgiving.
Leave a Reply