Portrait of a Manipulated Market
To me this is a reminder of silver in the early 1980’s when Bunker Hunt pulled his hat trick. Old timers know how that ended.
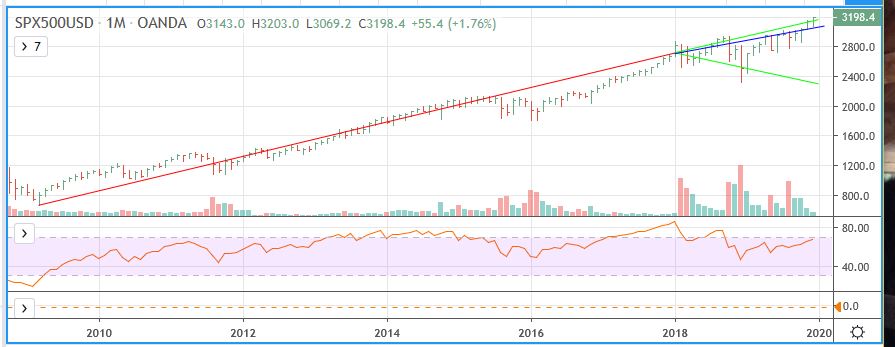
Here is a monthly S&P chart going back to 2009 bottom. Note that there is little volume on the rallys, big volume on the crashes. What I call the Crying Goose Formation. Look out when the blue line, the tongue, is penetrated on the downside.
This equates to a 3121 S&P price.
Note also the Monthly RSI is over 66.0 today.
Leave a Reply