The Fake Economy Unravels, Almost
The Long Story
One only has to look back to the April 2011 Bernanke QE2 announcement, that is when the US decided that it was not going to use stiff measures to punish the offenders that created the setup for the 2008-2009 crash. It was a soft measure that if a President ever had a reason to fire a FED Chairman, that was it, Obama blew it. Since then it has just been a series of soft measures leading to excesses which were capped by the Trump Tax cuts. Then the crowning act, the one that threw a spear into whole balloon, the Trump Tariff’s came along. It had to happen, we were just waiting for something to end it all, we knew it would not be Congress or the FED that would stop pushing the rock up the shill. One thing it is not about, is China or it’s executives, the media likes to talk about little sensational stories.
10:40 AM CST Bottom Pickers Are out in Force on Twitter Today
Many twitter talkers see this as a stock market bottom, so there may be a bounce to 2688 area again, but…
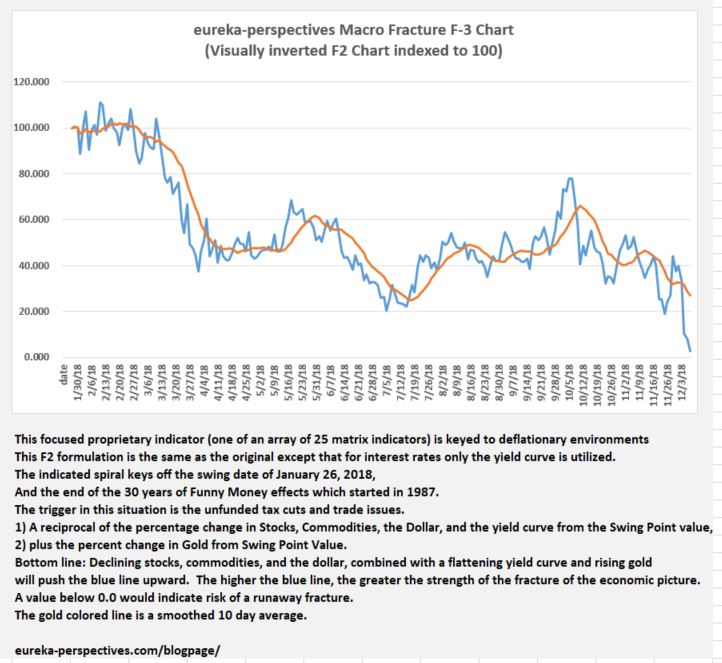
10:40 AM CST The F3 Fracture Chart is the Signal to Monitor Now
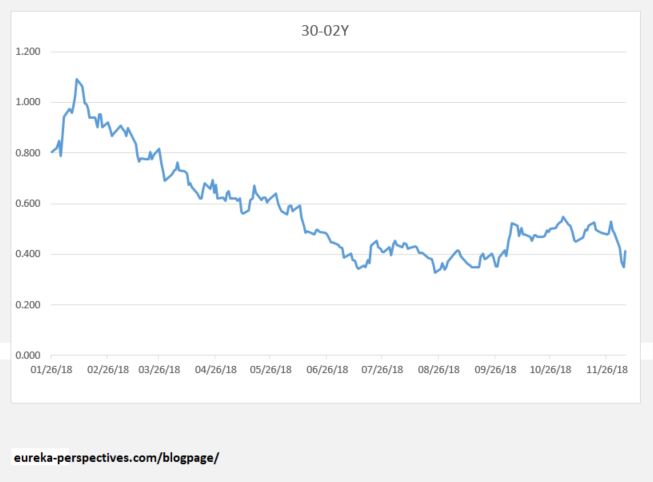
The F3 Economic Fracture chart is on the verge of confirming the start of a significant plunge in the stock markets. Ironically the only thing keeping it from triggering this morning is the fact that the 2-30 year yield curve has had a little jump up today as the 2 and 10 year interest rates are plunging faster than the 30 year rate, obviously reacting faster than the 30 year rate. As always, one can wait for different levels of confirmation, ranging from a one day penetration of “0.0” or a ten day penetration.
First is the 2-30 year yield curve chart.
And here is the F-3 Fracture Chart
Leave a Reply