Climate is bigger than Trump…February 16, 2026
The media rightly is painting a dire picture of what Trump is doing with the EPA regulations. The destruction of climate protections put in place over decades is going to have a big impact. However, one has to keep in mind that climate change is so much bigger than anything that Trump says or does, or for that matter what AI will do in terms of reducing employment.
Climate driven demand is going to keep going, a reflection of the industrial age that kicked off some 250 years ago (Wikipedia says it started around 1780). I would not be surprised that all the destruction of our land will be the biggest driver of the 2028 vote. People who flocked to Trump in 2024 are coming to a hard reality of how that vote has taken a toll on their health and life going forward and three years from now that fear will be embedded.
Here is a chart of our Climate Tech index that has been building since November 2021. That date is important as basically that is when enough breadth in climate related stocks became a factor. The ten stocks and ETF’s that are in this index are weighted in terms of performance stability. They are the core of our EV/Battery/ Environment/Biotech Climate Tech Model. They are: RIVN, QS, SLDP. ALB, RUN, JKS, QCLN, ICLN, XBI, and ASND.
You will note that TESLA is not in this index as I view it as having too many non-core climate aspects, stuff like politics and autonomous dreams.
Climate Tech Index
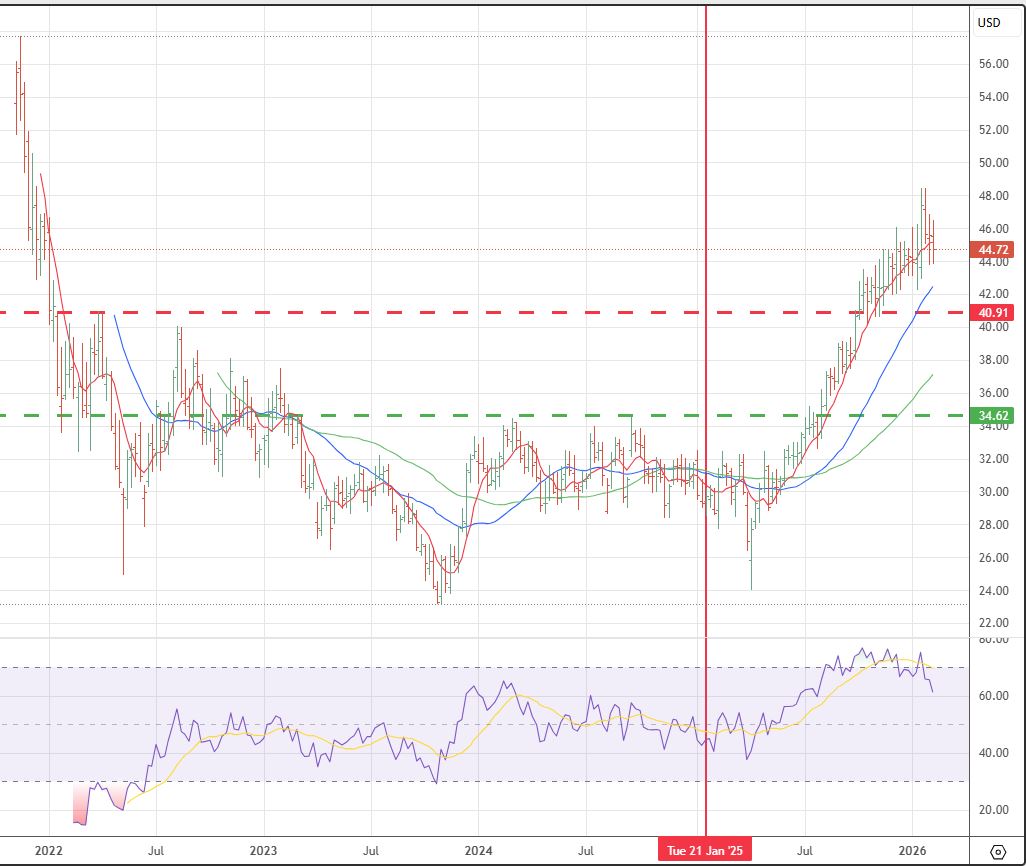
The red vertical line in the chart is when Trump took office. It should be obvious that his term has not been a big factor in the chart performance, in fact it has gone up in spite of all of his efforts to deny climate change effects. The market is smarter, coal and oil are so in decline, we have passed the tipping point.
What I did notice in looking at this chart today is that it has something for technical chartists to ponder. One could say that it has a head and shoulders bottom, May 9, 2022, October 30, 2023, April 7. 2025. A conventional 3X breakout of the October 2025 figure of 40.11 could put us in the 120 area by the end of the year.
When the anticipated stock bubble pops, probably sometime between October 2026 and October 2027, while one will most likely want to be in bonds and inverse ETF’s, I can see why this index will hold up better than the overall market. And then, of course after the crash is history, the environment will dictate this as a prime investment area.