The New Economy is Waiting in the Wings….
We all have been waiting for the bears who have kept trying to short the market to get done with another of their attempts. Halloween should bring an end to the foolishness.
Here is the index chart for our Climate Tech model going back to its inception on June 13, 2022. The index has nine component sectors containing the following stocks at the moment.
Sectors Stocks
| Support TECH | SNOW,CRM,ANET,SQ,DOCU,MELI |
| ENVIRO TECH | RDUS,BLD,LII,QQMG,CARR |
| Chips | NVDA,SOXL,SMH |
| Biotech | TWST,DNA,EXAS,SSYS,VCYT,TXG,NTLA |
| Future TECH | ARKK,ARKG |
| Solar | NOVA,PBW,RUN,PBD,ARRY,FSLR,CSIQ |
| EV | NKLA,TSLA,RIVN,LI,XPEV,EVAV,VCAR |
| Batteries | QS,ENS,PLUG,BATT,SLDP,TECK,CHPT |
And here is the chart using weekly data. The chart includes the data for the April-May 2022 crash period that set up the opportunity for the Model launch in June 2022.
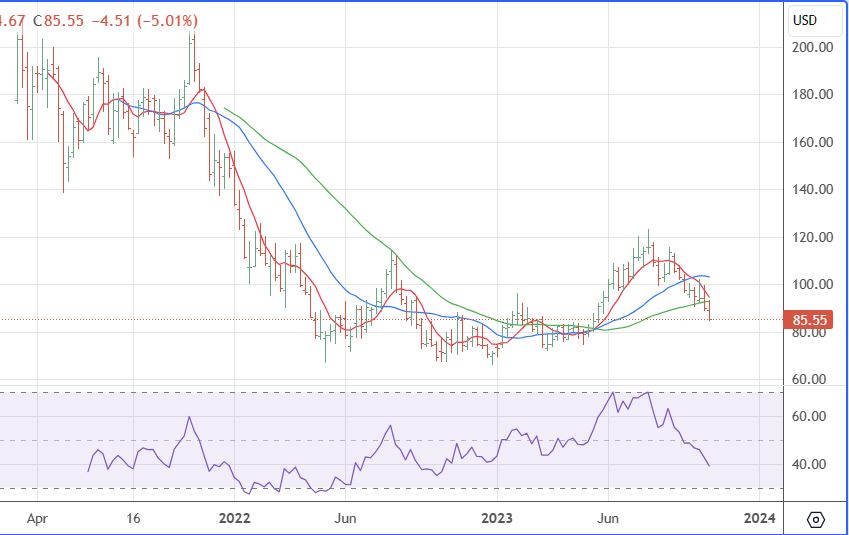
The basing period has been an eventful time. We saw model gains of 66 percent between June 2022 and July 2023 but the recent decline of 30 percent since July through last Friday trimmed gains. While the model did some short hedging starting in July, recent extreme panic on the part of market participants in the Climate Tech sector, especially Solar, was a bit surprising. Cumulative returns since June of 2022 are now 17.6 %.
The really good news now is the attractive prices that exist in the Solar, EV, even Biotech areas. Chip and Tech support kind of stocks held up relatively well turning the panic, however and are not quite as attractive.
Leave a Reply