The Pieces are Adding Up…
I continue to be of the opinion that economic growth with increased efficiency will eventually handle inflation. As stated here last week, there is still a period of time through the FED GDPnow numbers that will be released on March 24th. At that time we will have a better picture of the state of things.
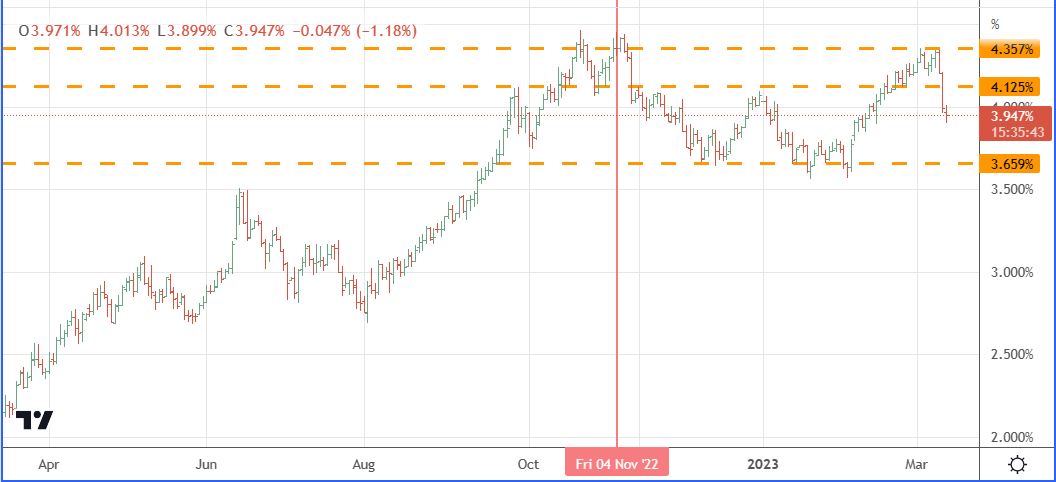
In the meantime the SVB chaos has brought in a reckoning for the FED. I have been saying since November 4th that the FED is pushing on a string with its Fed Funds rate, as market basket rates (30Y+10Y+05Y+02Y) stopped following the FF rate on Nov 10th. See two charts here, the first is the market rate basket chart. What is evident here is that rates topped on Nov 4th at 4.455 %, declined and then rose again to 4.358 % on Mar 2, 2023, and now have declined since the SVB chaos to 3.947 % at 1:00 AM this morning Mar 13th..
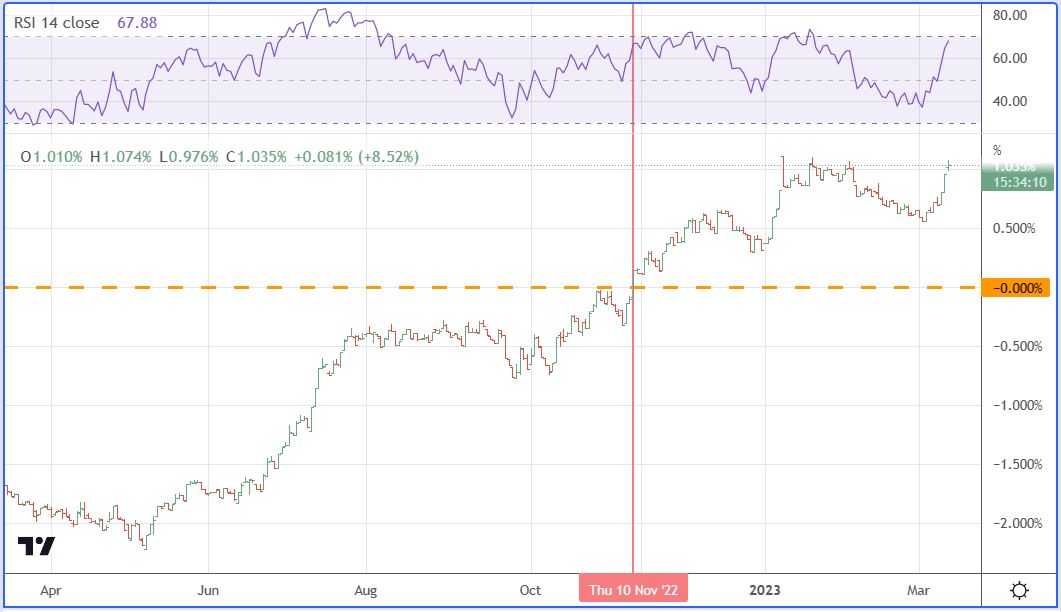
The second chart shows the YC spread between the 3 month FF rate and the market basket rate. The chart below shows the period of the last year and the steady rise of market rates vs the FF rate from March 2022 to Nov 10th 2022. After that the market basket rate stalled and yet the FED tried to force rates higher by pushing the FF rate to as much as 100 basis points above the basket, yet no new highs in the basket occurred. And that is where the FED sits in its posture at this point tonight.
A little analysis shows how the SVB story developed, apparently sources point out that most of the customers of the bank have large deposits and demand the highest return possible using FF rates as their guide. The bank however has to deal with clients borrowing funds using market rates as their guide. Obviously, the math does not work.
10:00 AM Update…
Maybe we need a different kind of Dot Plot, what I call the Five Step Bottom plot. One that keys on growth and efficiency to control inflation. It all started on May 11, 2022.
Dot 1 May 20, 2022
Dot 2 Jun 16, 2022
Dot 3 Oct 11, 2022
Dot 4 Dec 21, 2022
Dot 5 Mar 13, 2023.
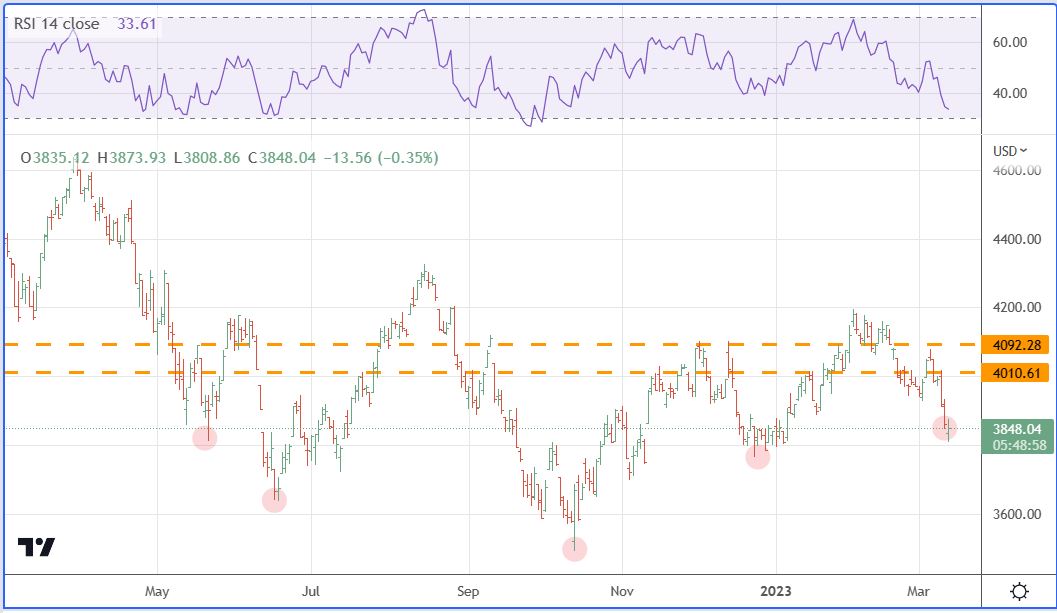
And one more point for perspective. May 11, 2022 was 209 trading days ago. And guess what the 209 day average of SPX is 3941, last night’s high was 3936. The average trade doesn’t have much profit or loss in it at this point.
Leave a Reply