Macro Picture…
We track the Macro Economy using an algo with market data inputs; SPX,NDQ,RUT,CRB,DXY,GLD,US02Y,US30-US05 YC. Recent points, a low Apr 2018, upturn Jan 2019, High Aug 2020, downturn Sep 2021, low Nov 2022, stimulus blowoff Mar 2020-Jan 2022.
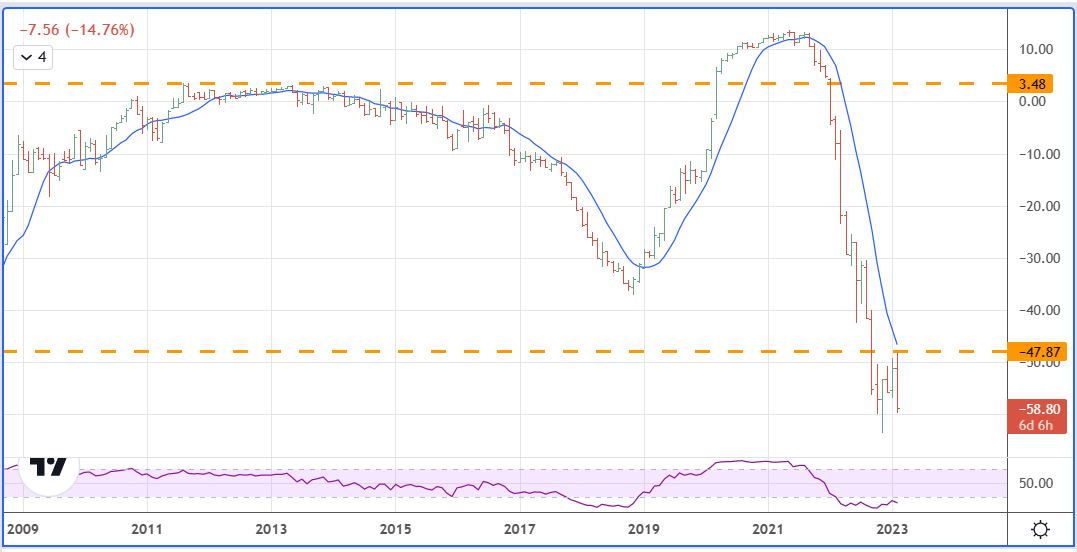
A couple of things for the current market jump out. One is that the first hint of a bottom consolidation for the economy occurred in June and July 2022. Now we are having a much bigger consolidation area September 2022 to the current February-March date.
An important point must be made here, stocks don’t trade exactly like the economy does. At times, the multiples create huge lags at tops and hughe pushes at bottoms.
Here is the same chart as above, only this is our trading floor chart that uses 30 minute data updated through today at 10:45 AM CST.
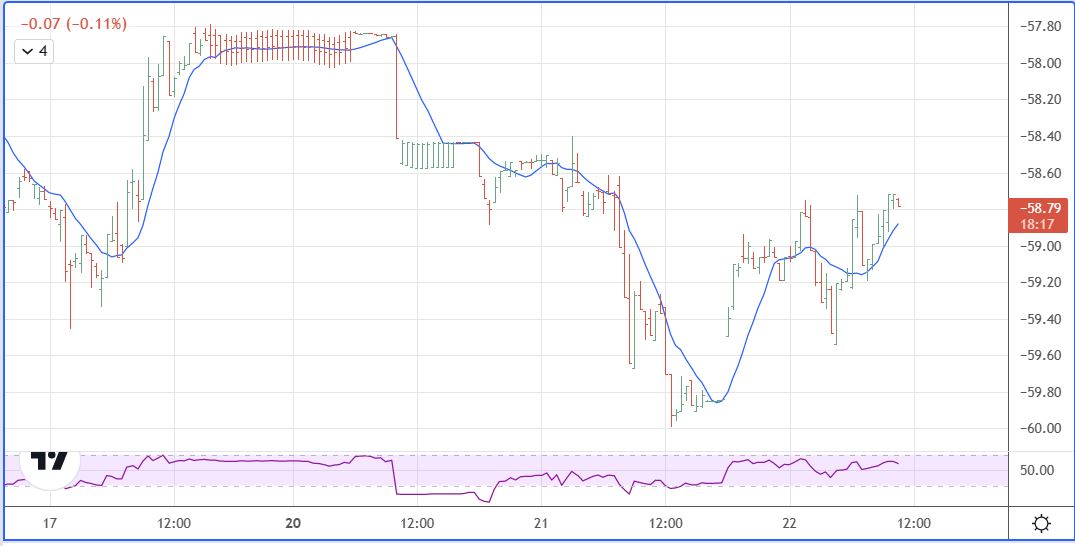
The short term picture hints that maybe some of the eight inputs are signaling strength.
Leave a Reply