Applying the 2023 Outlook #1
January 4, 2023
For me a few headline views:
- Inflation is key issue.
- Inflation numbers topped out in June 2021
- Factors pushing those numbers were primarily Covid and Ukraine/Russia related, ie. supply chain and excess cash pushed out by the government, through both FED and Fiscal efforts.
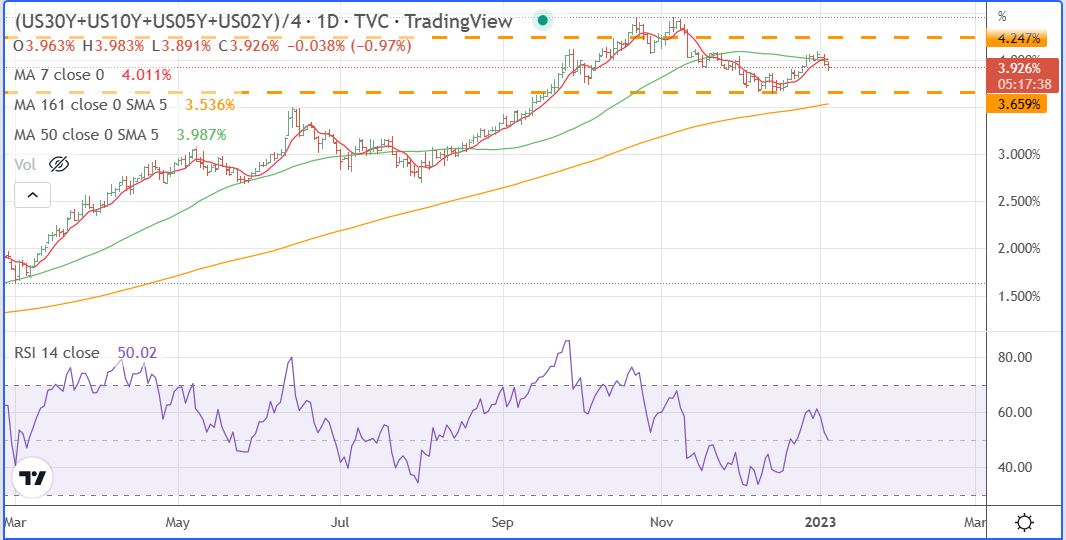
- At the moment, the biggest factor is that the FED is pushing FED Funds rates into overkill mode, yet market rates topped out on November 4th and are not following the FED.
- Our 2023 Forecast issued on 1/3/2023 explores that phenomenon.
Charts from this morning at 11:00 AM CST:
The first chart illustrates where the FED is relative to market rates, ie. the rate the market assesses as being congruent to economic issues. Numbers above the zero line show FED overkill. I would call this morning’s spike up on FED Funds rates as a Hail Mary attempt.

The second chart is of the composite market rate.
Trading approach based around the above factors is:
- With inflation coming down, the most obvious place to avoid is oil related stocks and maybe even look at the 2X Short oil ETF, SCO.
- With interest rates starting a decline, a long bond ETF may be looked at, like the 3X ETF TMF.
- In terms of stocks, the grass roots nature of the move to a New Economy would suggest looking at small cap stocks with the 3X ETF TNA front and center.
- The S&P and NASDAQ stocks will be followers, not leaders of the movement. Grass roots momentum will not see people getting a new iphone every year or wasting time updating ROKU, or watching Disney.
- The New Economy stock portfolio that our model has built since the start of the stock market bottom on May 11, 2022 has been under extreme pressure by the Big Money Wall Street crowd over the past two months. I look at this model as very oversold and fundamentally sound once the market goes beyond hiding and moves into the future.
- Of the five sectors that are part of the eureka-perspectives New Economy Model, Biotech has held its own coming in second place of all the market sectors with a 6.08 % gain since June 6, 2022. On the otherhand EV has come in last at place with a 48.4 % decline over the same period. Our other two New Economy sectors saw Solar at -8.6 %, Chips at -15.0%, with the overall New Economy Model EPCC shows a 14.6 % decline.
- The sectors of the market that showed positive gains for the period are Banks, Retail, Ag, and the Dollar.
See Chart here of market performance since the June 6, 2022 inflation peak.
| inflation Peak | ||
| INDEX | to today | |
| 06/06/22 to 1/3/23 | ||
| Banks | 7.95 | |
| BIOTECH | 6.08 | |
| RETAIL | 5.77 | |
| AG | 3.54 | |
| DXY | 0.47 | |
| SHY(2Y) | (1.59) | |
| SPX+ | (1.63) | |
| GOLD | (1.67) | |
| SPX | (1.95) | |
| HYG(junk) | (2.46) | |
| INFR | (4.03) | |
| IEF(10Y) | (4.14) | |
| FANG | (4.95) | |
| NDQ | (8.21) | |
| comp | (8.25) | |
| SOLAR | (8.57) | |
| TLT(30Y) | (10.84) | |
| T&E | (11.67) | |
| EPCC | (14.55) | |
| CHIPS | (14.96) | |
| CRB | (17.33) | |
| ARK+ | (20.00) | |
| MEME | (22.03) | |
| WB FG | (25.81) | |
| BTC | (32.56) | |
| USOIL | (35.81) | |
| EV | (48.39) |
Leave a Reply