A New Year Beckons..
This post is after the close of trading on Friday, December 30, 2022.
This has been a year where again the FED’s refusal to allow the economy to function on its own dominated the action. Following 2021’s FED refusal to put low interest rates and increases to the balance sheet aside even though the need had expired in late 2020, we saw a move in 2022 to start with rhetoric and later with rate increases to downplay their mistake.
The tragedy of all this is that the FED allowed the big money people to leave the markets early in the year and then provided ammunition to the short sellers as the rhetoric shifted to how wage inflation was the problem, and the cure was to push people out of jobs and crash the economy.
In spite of all that we again see the markets tilting into trouble where market players are extremely bearish in spite of GDP providing strong numbers and wage inflation and jobs relatively stable as the year ends. We will talk about this in our 2023 forecast which should be out on Monday, January 2,2023.
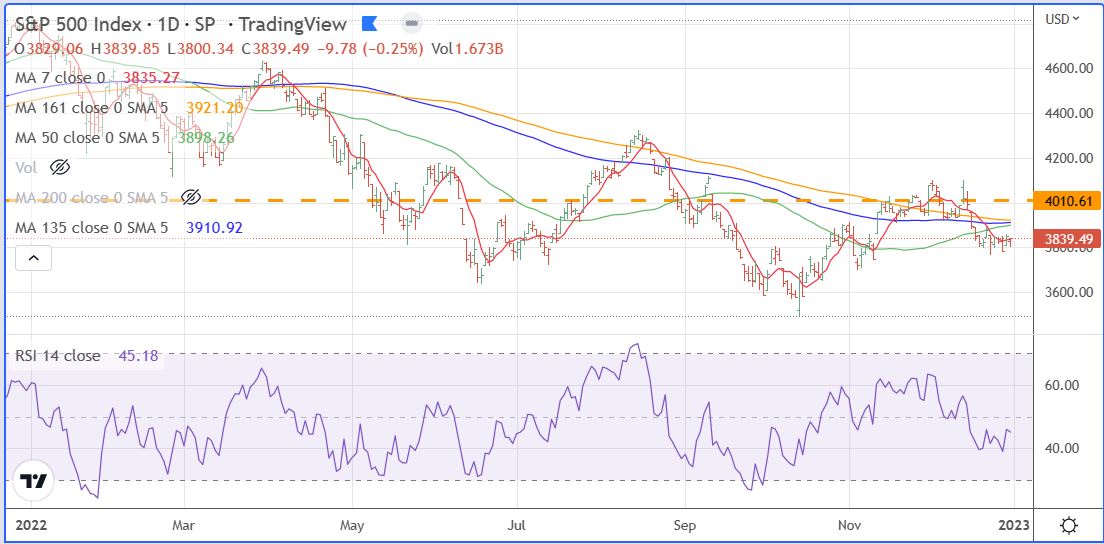
In the meantime, here is one chart for you to ponder while we complete the number analysis. the chart is of the S&P and shows how the stream of prices clearly has outlined a bottoming formation that started on May 11, 2022, and is continuing until this day. The Red dotted line across the chart is based on the low for May11. As of today, the market is out 161 trading days from May11 and 135 days from the first of three bottom areas on June 16. The chart has three average lines, the traditional 50 day, and the two special 135 and 161 day averages. All are converging on the price area of 3898, 3910, and 3921.
Leave a Reply