Growth vs Recession Picture..
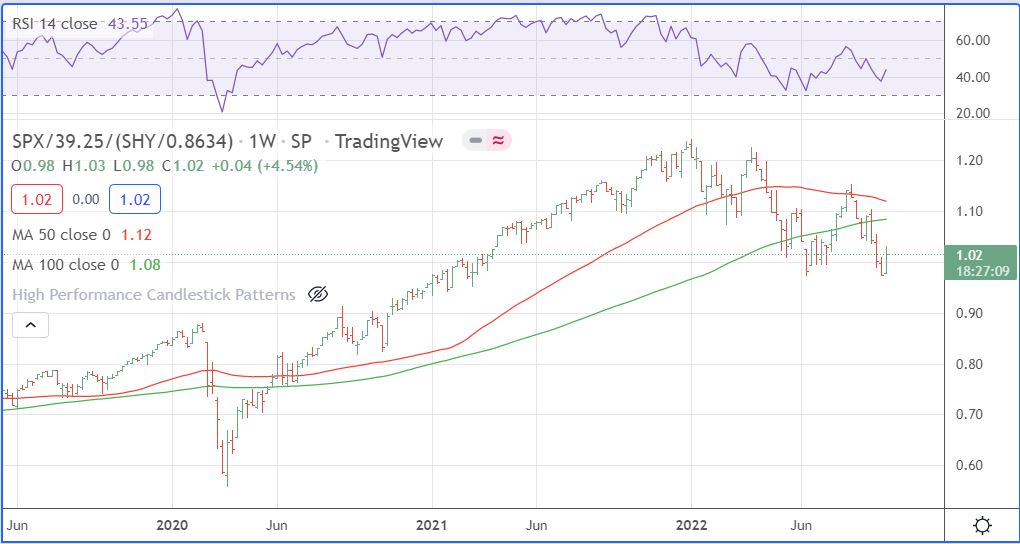
Tomorrow’s employment numbers should set the stage for the battle. I will be looking for clues in the chart below where we look at the S&P vs the 2 yr note.
The chart divides the S&P index by the 2 year note index and uses weekly data to provide a bigger view. It shows the market outlook and tomorrow will show the impact of any new news.
The expectation is that there were 275,000 new jobs in September. If the number misses on the low side at “0” or on the high side at 500,000 , that will be new news and of course the market may be biased starting out due to market player positions.
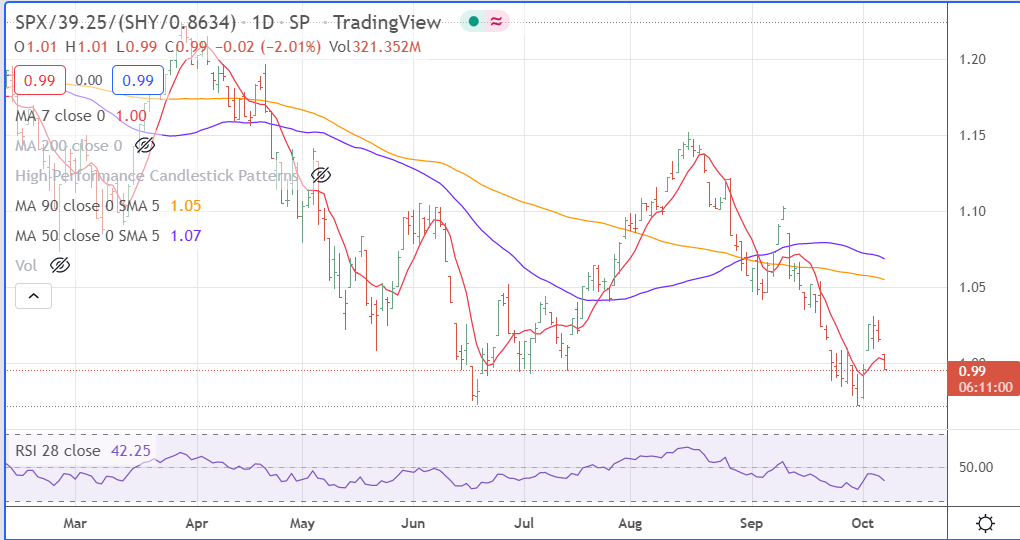
Just looking at the chart it is obvious that seven weeks ago the market ended its summer rally, but also shows that there is a double bottom in the relationship, June 3 and a week ago. We will be posting an update at 9:00 with this same chart using 30-minute data.
Here is the 9:00 reading of the Daily chart, obviously the market players are leaning hard on the Recession fears based on good job numbers, chart is down testing recent support levels. I am on record that I believe that the recent lows will hold, let the day go on, and CPI numbers are coming up next week.
Leave a Reply