Opportunity Time & Meltdown Chart
A little review here on what we see now.
- The dollar is a key ingredient, the December lows where we put on our initial long dollar DXY positions at 90.13 was added to yesterday at 92.79. First objective is in the 97.00 to 99.00 area.
- New position of short bonds, bought TBT (short Bond ETF) at 17.10 yesterday. Interest rates will go up from here.
- This morning was an add on morning for short S&P and Nasdaq. Bought triple short SPXS ETF at 23.24 and triple short SQQQ ETF at 8.81.
This is Give Back Time for all the FED Powell followers. Extreme volatility where they sell the lows and buy the highs in equities. All the while ignoring the historic trap that was set up in the bond market over the past month.
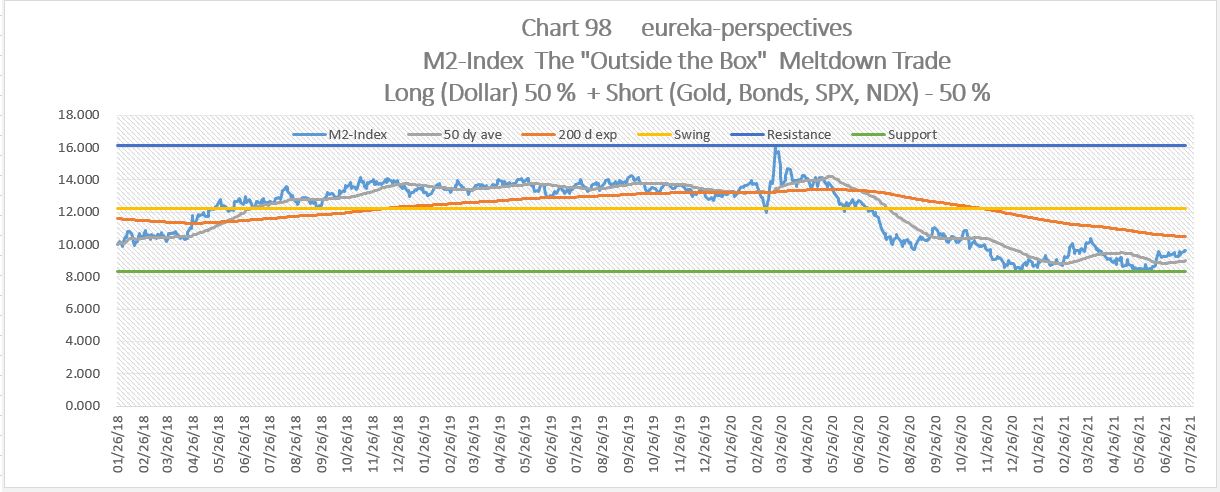
And here is the Meltdown Chart we track.
Here is our chart of the Meltdown Trade. Double bottom 1/6/21 and 6/10/21. Interesting dates. Very early in trade, still way below averages.
Leave a Reply