Blow-off Confirmed ??
In an artificial market environment in which we all must play, an environment with overwhelming Federal Reserve influence, one never knows for sure if a signal is real or influenced. What we are seeing the past few days in the interest rate, currency, and stock markets is a good example.
Here is a chart, updated today, that is a good example of that situation.
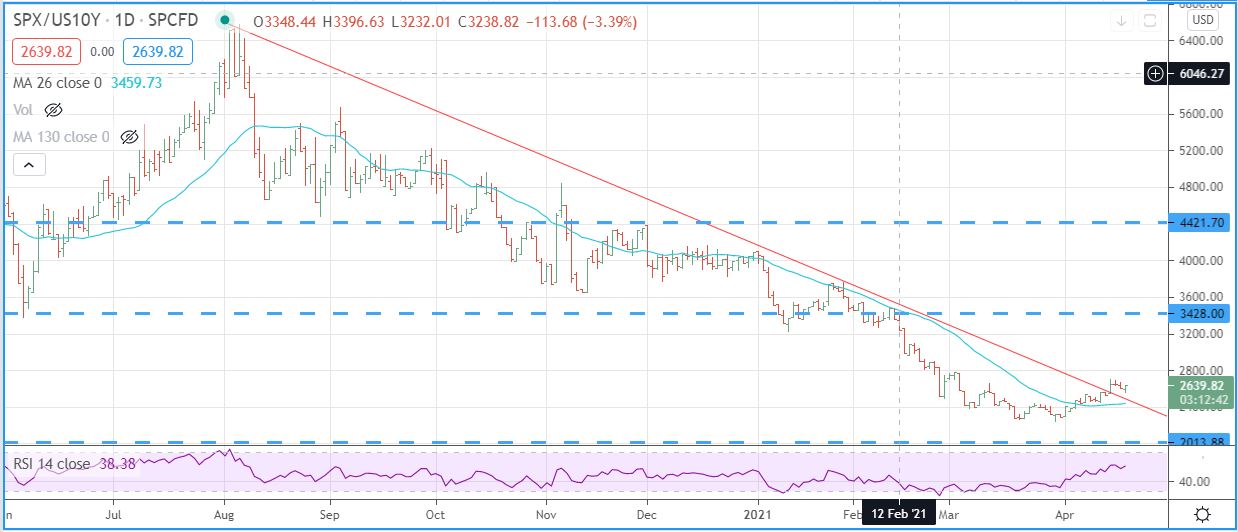
What you are seeing is the S&P market divided by the 10 year interest rate. Today that would be S&P @ 4125 and 10 year rate at 1.559, so 4125/1.559 = 2645.
What is important to point out here, is you see the red down trend line starts at the the August 6 peak we have mentioned many times and bottomed on March 30 of this year. Then last Thursday, April 15, the red down trend line was pierced. What does that piercing mean? Is it a reflection of some Fed action. It could mean the Fed wants to stop the rise in the ten year rate which went on for 8 months, or it may indicate that the recovery trade has run its course and stocks have run out of gas. In any case we are seeing indications that things have changed. It could mean that interest rates and stocks will race each other down, that could be interesting. After all. what we have seen for the past 8 months is both stocks and interest rates rising.
Leave a Reply