Bending but Not Broken
What we are talking about here is the Market Fracture charts that we use to put a number on an economic environment and hopefully make sense of it.
First, it feels good to have been outside the mainstream for the past 5 days, no internet, no cable news. I figured that the best time to do this was at the beginning of earnings season, you never know the degree, but earnings usually beat estimates, isn’t that interesting, how can that be?
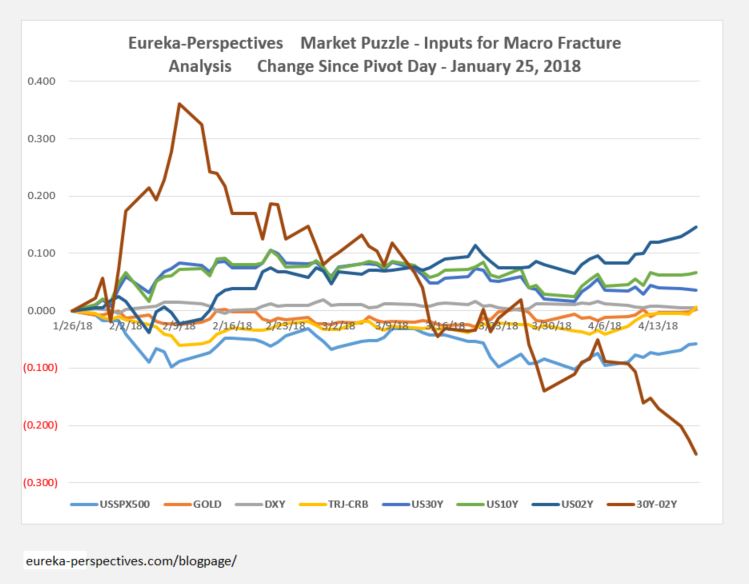
The Market Puzzle
What is interesting is that the January 26th market swing point still holds and the interest rate yield curve still is flattening. Also the Fed’s GDPNOW shows 1st Quarter GDP coming in at a lower 2.0 %.
See the four charts here to put all this in perspective, charts updated through 9:30 AM CDT.
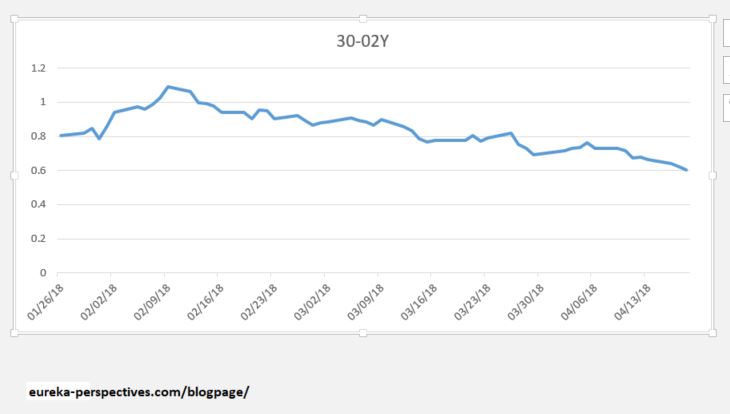
 Next the 30 yr – 2 yr yield curve continues to decline.
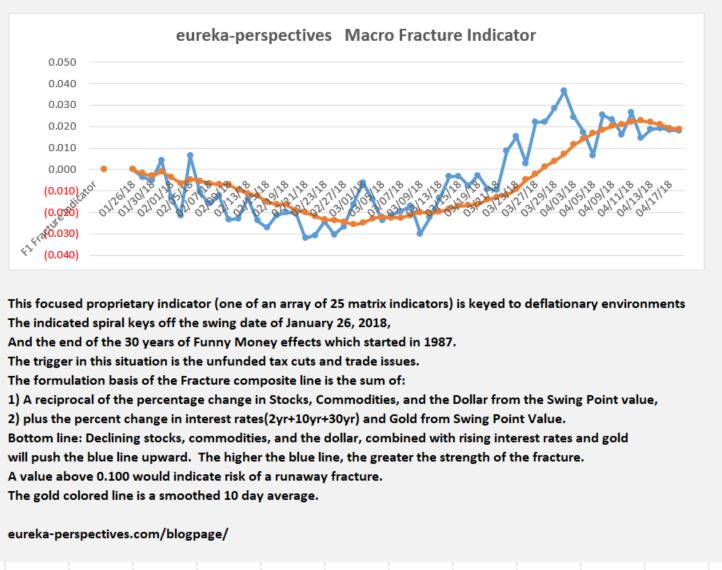
 Next the F1 Macro Fracture Chart that includes interest rate yields.
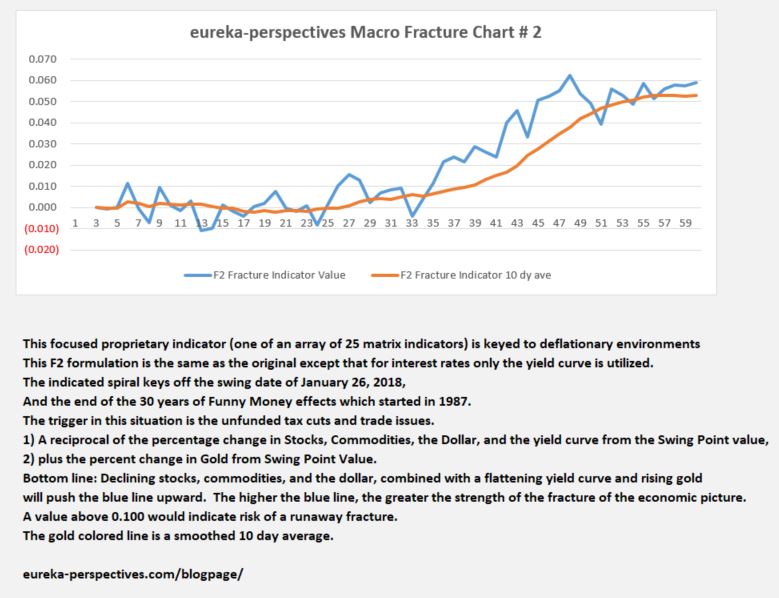
 And the Macro Fracture Chart that utilizes the yield curve as one of its inputs.
Leave a Reply