A little Full Moon Action
Today is a full moon. Traders never ignore that fact.
But anyway, the charts are evolving after last weeks counter trend moves on stocks and interest rates.
After discussing our regular blog with clients, we have decided to continue with the blog and reserve our periodic in depth market study presentations for paying clients.
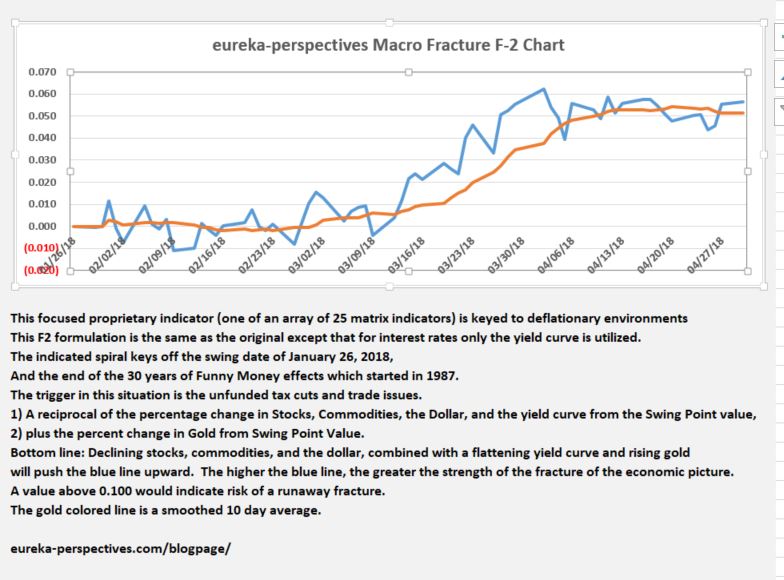
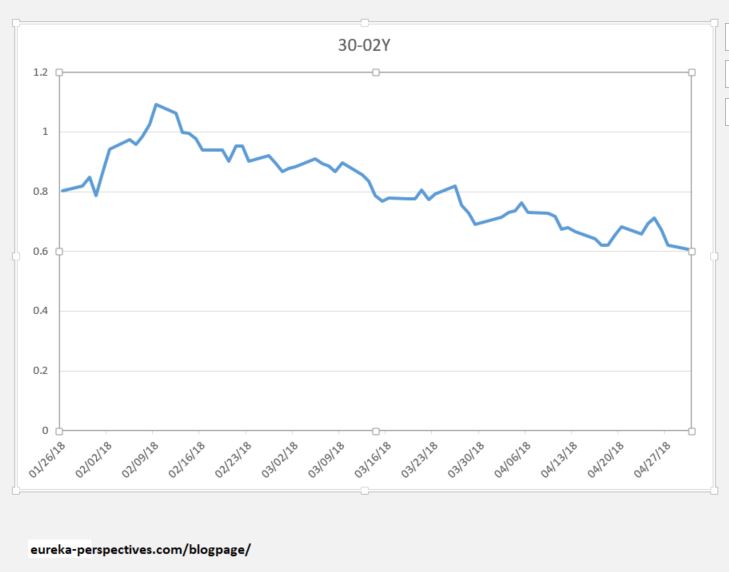
Here are the Fracture related charts as of 10:30 AM CDT today when the S&P was at the 2670 level.
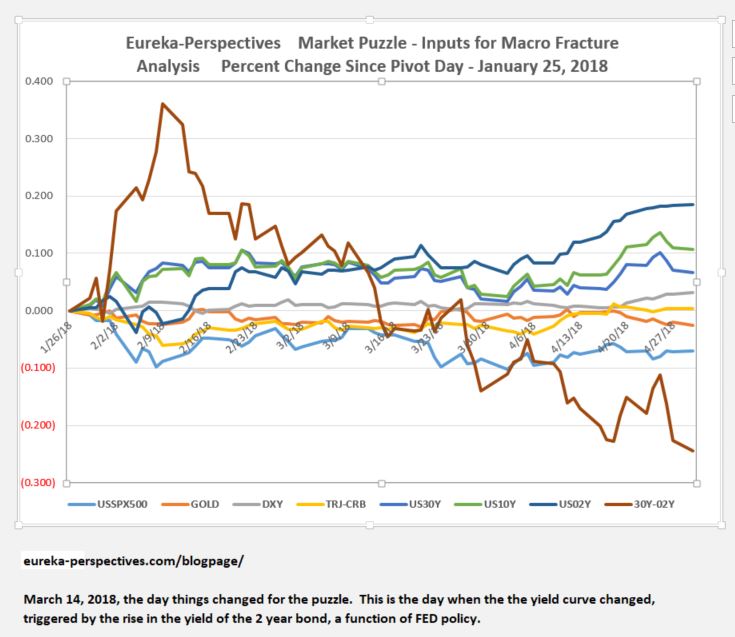
It would appear that the fracture line is getting staged for a large movement up, which will be negative on stocks and probably push the markets down through the 200 day average on the next move.
Leave a Reply