The Goldman Sachs/Trump Economic Plan hits a Snag
How could Goldman Sachs, whose people are trying to run the economy, hit a snag in trading profits in the first quarter. Kind of interesting, maybe they were trading their own ideas. Maybe it backs up my content back in January, Goldman Sachs people are better at feeding off others, than building a plan for others in the country.
Technically, the Goldman Sachs chart can be interpreted as a either a double top or a head and shoulders top, either not good. See chart below captured at 9:30 AM CDT today.
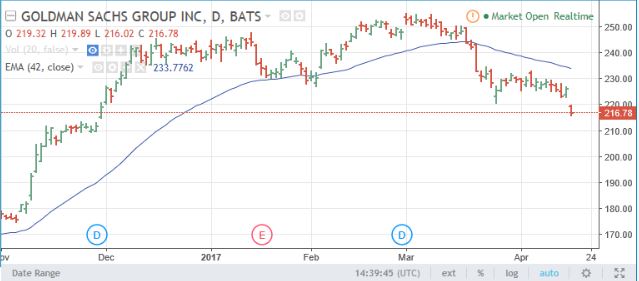
In the head and shoulders version the head was made essentially between mid Feb and mid Mar. In the double top analysis, the first top is mid Dec to mid Jan and the second top is mid Feb t0 mid Mar. In any case a close below 220 today will show the start of a confirmed breakdown out of the formations.
Leave a Reply