Defensive Posture and the Big Picture – Deflation
It is ironic that the media views the Greek and China events as sideshows to the greater economic environment. We view current market volatility as part of a bigger picture. The move towards deflation which was triggered in 2009 has not been resolved by either Global Central bankers including our FED or fiscal measures by the various world governments. The main consequence of QE3 was increased inequality and a rally in paper assets.
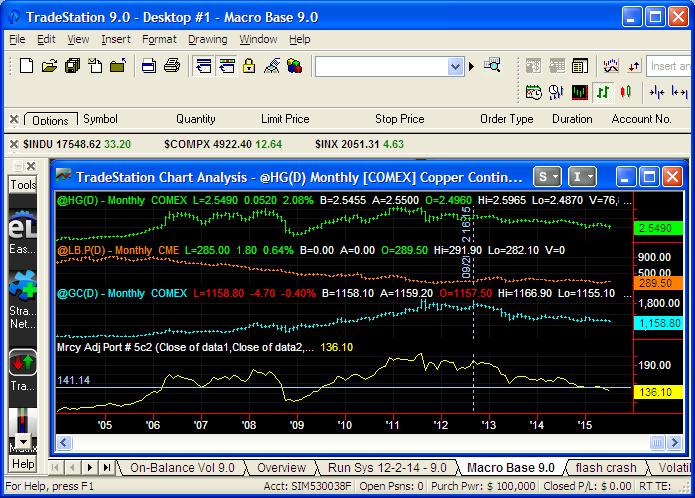
This is the basic chart that we like to watch, an index made up of copper, lumber, and gold. Month end dates and value points of significance are:
January 2007 Support level before the 2008 high index value 141.14
February 2008 High before 2008-2009 decline index value 180.51
December 2008 Low of 2008-2009 decline index value 112.04
August 2011 High after QE1 and QE2 inputs (took out 2007 hi) index value 216.30
September 2012 QE3 Implemented after inflation index stalls index value 200.61
May 2015 Index tested 2007 low index value 141.30
June 2015 Index breaches 2007 low (down 31% from QE3) index value 138.24
Our premise is simple, we think it is likely that real asset deflation will work its way eventually into paper asset values, and we have not even included crude oil in this particular index. As always, the Central Bankers will continue to try and defend their actions. This will keep volatility high with a lot of ups and downs.
Leave a Reply