Oil Bottom, Is it Really ?
You know where we are on this question. We believe that the deflation wave is the primary metric, and that basic materials like oil, copper, maybe even lumber are feeling the pressure first.
You also know that for some time we have been talking about a $ 22 extreme low on oil sometime before 2017, not necessarily soon. What most interests us in the near term is the expected downside in oil stocks.
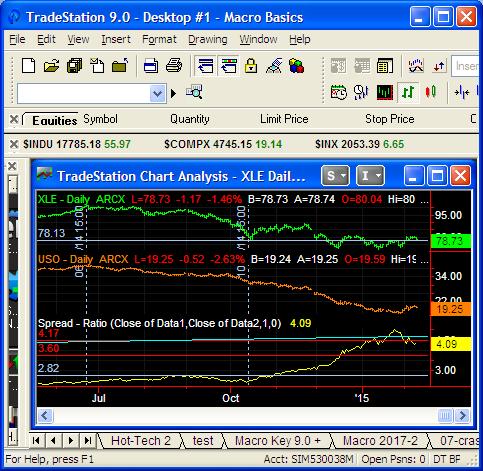
The chart included here shows the relationship between two oil ETF’s, USO (basic oil) and XLE (oil companies). The chart shows that when the second stage decline started last summer (6/23/14) that the ratio of XLE to USO bounced around 2.5 and that this was still the case when the XLE started trying to make a bottom on October 14th 2014. Since that date of the so-called early XLE bottom, USO at its extreme low dropped around 46 percent and the XLE/USO ratio peaked at 4.63 on January 26, 2015.
What is interesting on a daily chart pattern analysis basis is the head and shoulders top on the ratio chart between 1/6/15 and 2/4/15. This would imply that soon XLE will start losing to USO. There are a lot of reasons thrown out as to why XLE has gained so much on USO, one reason preferred by the market is the cost of storing oil kept pressure on USO. The other reason that we prefer is that the funny money legacy in the stock market has a long tail and makes it easy to see markets diverge from fundamental factors.
See chart here:
Yesterday’s portfolio performance saw small changes in the NAV. Both funds were a bit higher and the S&P 500 was a bit lower. With the data in the table that we have shown over the past three weeks we have enough of a trail built that on a daily basis we will just state the daily changes and then periodically publish a table and chart.
Leave a Reply