The Day the Fed Effect Peaked
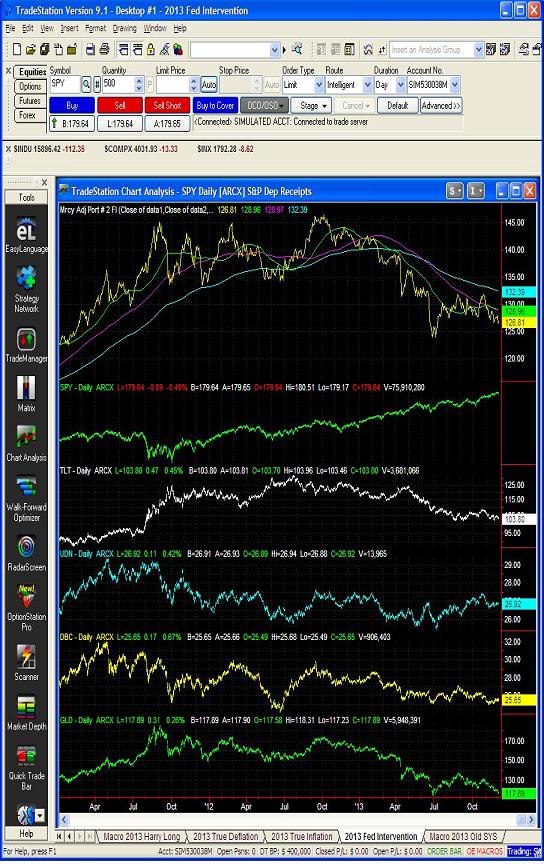
The chart above shows five primary market sectors that are affected by FED policy. For this chart we use ETF’s because it facilitates grouping a large number of stocks, commodities,etc into each market sector and therby allows a broad view. From this we use an index (top line with moving average lines) to see the direction of the aggreagate effect. The premise of the Eureka FED Index is that the FED EFFECT when it is working will fight the underlying deflation momentum by:
1) Raising stock prices (SPY ETF).
2) Raising T-Bond prices (lower interest rates) (TLT ETF).
3) Lowering the value of the Dollar (UDN ETF).
4) Raising the price of commodities (DBC ETF).
5) Raising the price of Gold (GLD ETF)
The chart (picture here is of the period March 2011 to December 2013) of the aggregate index paints the picture that is at the center of the debate on FED Policy. Note that the aggregate effect peaked on October 4, 2012, just weeks after QE3 started on September 13, 2012.
1) Since that date, paper assets (SPY) have moved higher as it is much easier to use funny money to buy stocks than other assets.
2) T-Bond (TLT) prices topped on 7/24/12, before QE3 was announced.
3) The Dollar (UDN short dollar ETF) is virtually unchanged since the start of QE3.
4) Commodities (DBC) and Gold (GLD) are down significantly since the start of QE3.
Leave a Reply