Performance Review 12/31/11
Performance Review 12-31-2011Last entry: 10.4.12
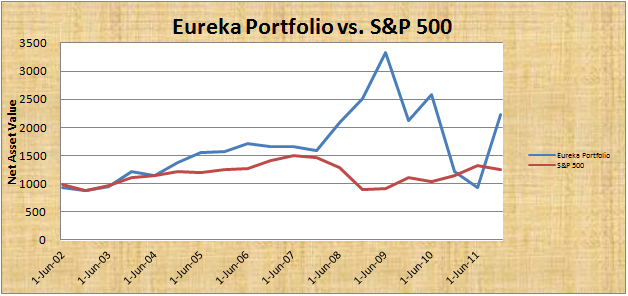
The chart below is for the performance of our tracking funds at Marketocracy.com (they track the general directions of the positioning that we mention on this site). These four funds were mentioned in the Reflections/Why section of this site in January 2008.
The chart here is for the composite index based on the four funds. The overall track record goes back to 2002 (before this website) and was for the first five years primarily a long gold approach with some stocks. In 2005, leverage and long/short strategies that incorporated ETF’s were added to the mix.
In the four years since the start of this website we have seen performance over a wide ranging area. The short stock and short ETF positions worked well into the March 2009 bottom when we reversed to basically long positions for the bounce into the fall of 2009. At that point we generally moved to short stock positions and increased leverage over time, reaching a high of around 4:1 short in March 2011. During the period of the Bernanke QE2 period, September 2010 through June 2011 we saw a large decline in our equity but held on into the October 2011 lows where we reversed to long stock positions for the late 2011 to early 2012 bounce. Our take back in 2010 on the QE2 was that it would increase speculation by hedge funds (more funny money), create inflationary pressure in commodities, and not be beneficial to the employment situation. Unfortunately we were correct on all counts but the pressure we felt in our equity position was not fun.
Currently, January 12, 2011, we are exiting most of the stock positions and are holding short gold positions based on the predominate austerity issues developing. We started leveraging up the short gold position in the summer of 2011. At the moment there is talk of QE3 by the FED pundits. To us what is important in stimulus packages is whether or not the stimulus is targeted for areas in need, like housing currently, or is wide open as was QE2 which floated into speculation rather than solid economic growth.
Our daily blog or our blog archives can keep you up to date and provide historical details. On the Marketocracy site we have an overall record of a very strong Alpha and a very low Beta. For the four years since the start of the website we are up around 40 percent while the stock market is down around 15 percent.
Leave a Reply