Peek-a-boo phase of an Anxious Market…
I doubt that the market moves we are seeing this week are about GDP, interest rates, or inflation. It is totally about the market having a hard time coming to grips with over-valuation AI based metrics. Meta was the canary.
From a technical nature I believe we are seeing what old-time traders call the peek-a-boo phase right before a cleanout break in a market. This is a time when a top has been constructed, a small sell-off occurs, then a wildly exuberant rally pushes the market back up towards the highs. This is a time of maximum anxiety for the market. It is either going to make a new high or it is going to collapse and have the cleanout break that will setup the base for a new bull phase. I believe it is the latter. Of course I could be wrong and the market could directly push to new highs. We will see.
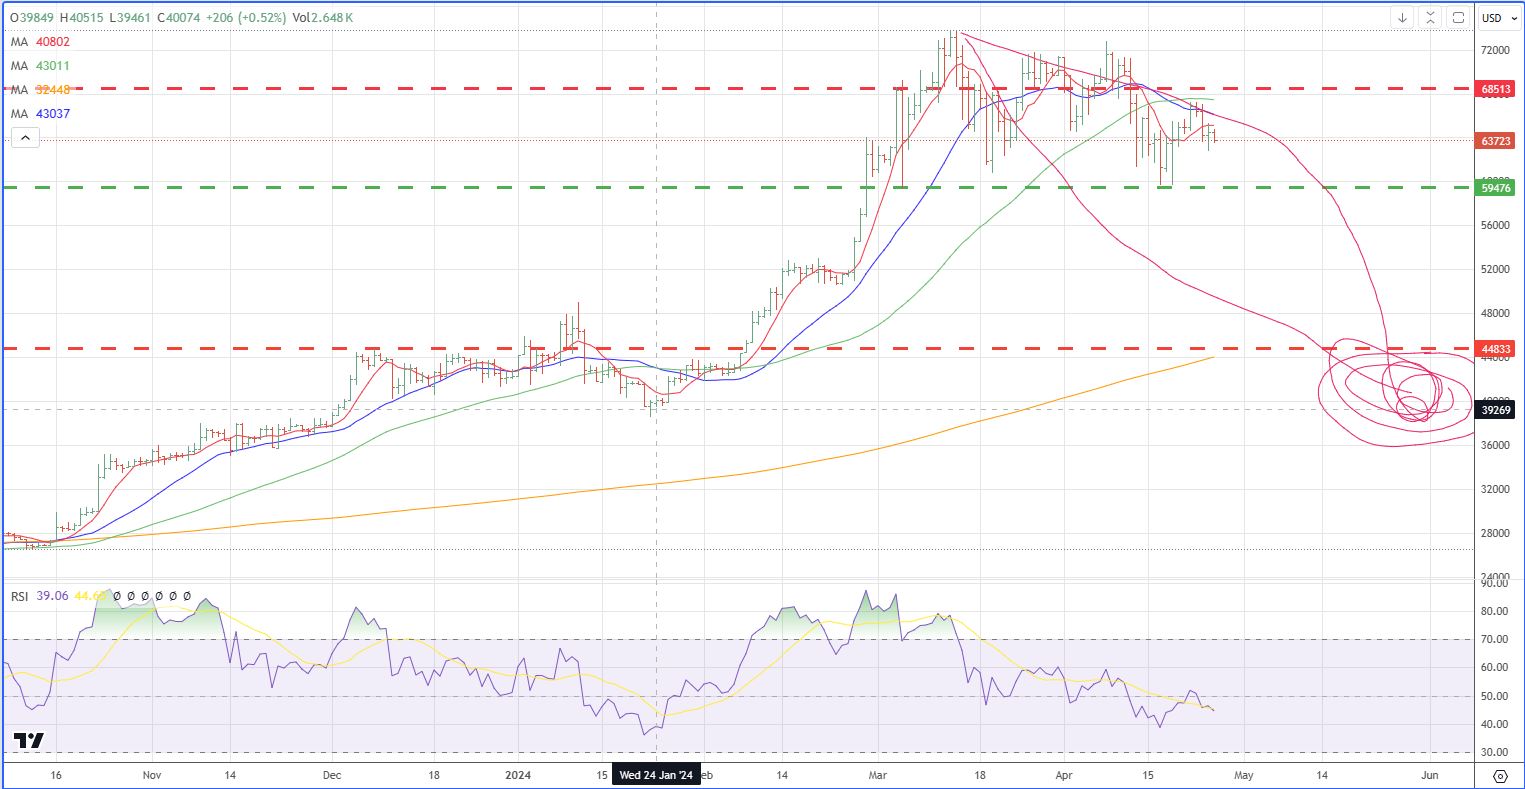
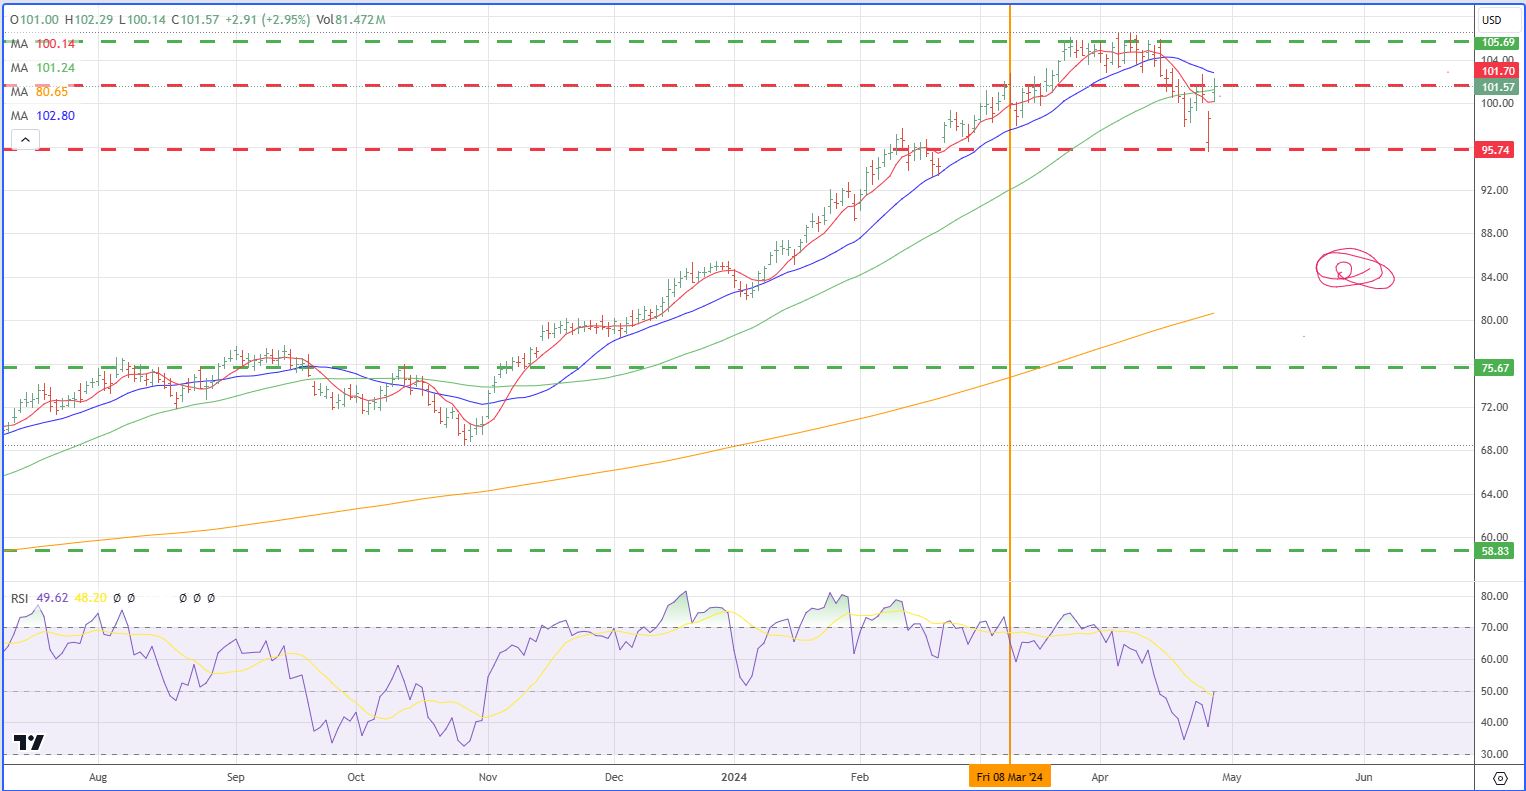
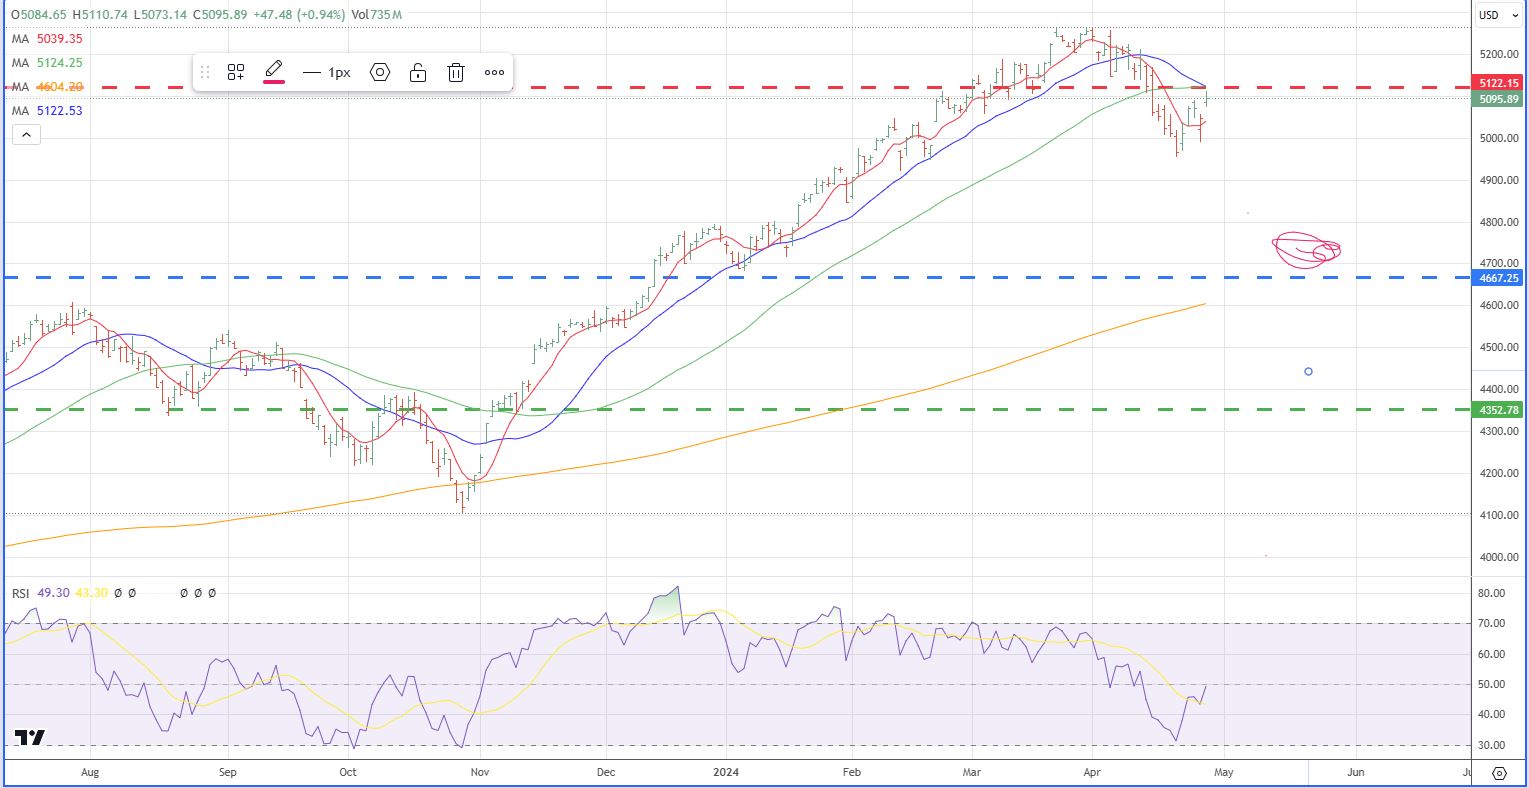
Here are three charts, charts I have presented before, these updated through mid-day today.
The first is the Bitcoin chart, always a good measure of market temperance.
The second chart is the AI Buildout chart, a good check on the prime driver of the current market. Yellow vertical line corresponds to March 8, the date of the overall market top, the AI stocks held on longer.
The third chart is the conventional market story, the S&P 500. If this analysis is on target, an optimum sell area would be in the 5170 to 5190 area, may want to scale in from 5110, every 10 points, that would provide an average near the March 15 initial sell point..
Leave a Reply