2024 Economic and Market Preview…including Chart F-1
Our forecasts for a number of years have used indexes with a starting point of Jan 1 2005, a time before “Funny Money” became the market. In many ways as “Funny Money” influence has waned since the peak in the March to June of 2022 period, we are seeing the economy and the markets being forced to use real economics. Ironically the result is that instead of the doomsayers prediction of an economic collapse once the FED got tough, is that we actually see a return to efficient markets and real growth. No doubt instead of using money to play games, money is being allocated to areas where things work and growth is possible.
The losers that are slowly cropping up are consumer type areas that are based on fluff rather than production of needed products. 2024 will see more of this and no doubt a lot of volatility in the first half of the year as players juggle their election forecasts, but as the election trends start to coalesce and winners become apparent after August 1, we expect to see direction appear. So, a flat to down first half and a strong second half would be our guess at the moment.
More charts and discussion over the next week or so as we present our full Market Preview.
Chart F-1 Composite Liquidity Index vs GDP Growth
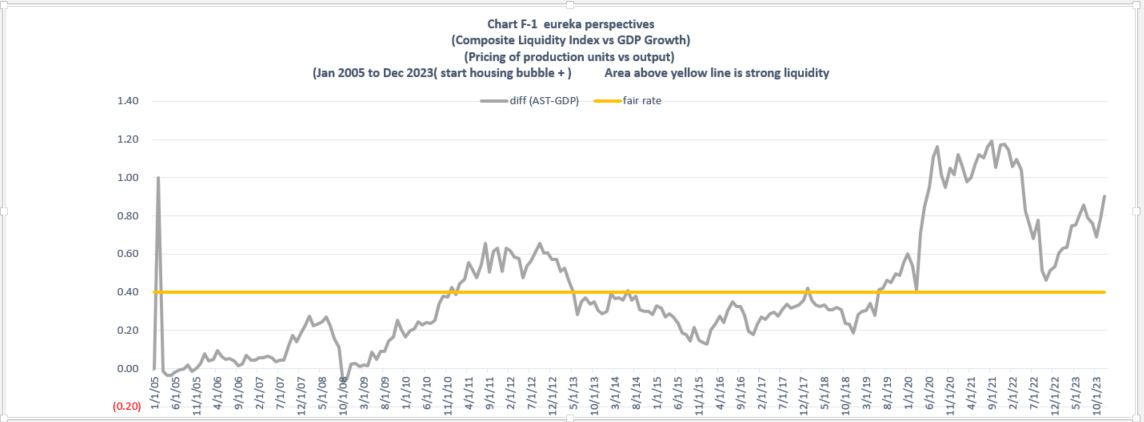
The liquidity index is a composite of values of stocks, bonds, commodities, and precious metals.
When the Liquidity Index is compared to GDP output.
What do we see?
- Prior to December 2010, the 2005 to 2008 housing buildup, 2008 GFC crash, and subsequent rebound of the liquidity index.
- December 2010 to May 2013, the initial Funny Money reaction of the liquidity index.
- May 2013 to June 2019, a period of settling in, adjusting to less efficient Funny Money activity.
- June 2019 to Covid Crash of March 2020, Funny Money back on the front burner with addition of liquidity from Trump Tax Cuts.
- March 2020 to February 2022, more Funny Money complements to liquidity by Covid based cash injections.
- February 2022 to December 2023, Liquidity growth based on production efficiencies.
- December 2023 forward, with liquidity index at 0.90, we see robust liquidity running into March 2021 resistance area of 0.98. Things will be ok, but strong upward market moves will be nothing like the 0.46 to 0.90 liquidity index rise seen between October 2022 and December 2023.
Leave a Reply