Bear Trap or Impending Doom
On July 27th our Climate Tech Model hedged it’s positions by selling out its RUT and Chip stocks and bought market short positions through the SQQQ and SPXS Short ETF’s. I have to say I am amazed at how well it worked out.
But, now I am in a quandary, the model points to EV and Solar stocks as extremely oversold and that the short hedges should be taken off. At the same time I have to look deeper at why the model suggestions worked. Here are some things to think about:
- On the surface this whack job on the market has been about the FED pushing for higher rates when the need is really non-existent other than the fact that the economy is a lot hotter than the FED ever thought possible.
- The last GDPNow estimate by the Atlanta FED is looking at a 5.8 % increase for the 3rd quarter.
- The talk of recession that some believe drove this recent sell-off probably needs a lot more substance.
- One big overhanging factor is the continued decline in the FED Balance Sheet which still has a long way to go. Will a market recovery have to wait for the FED rate hikes to reverse, which could be years away.
- Maybe the economy is just going to move forward and ignore all these FED negatives.
- Tackling climate change challenges is the biggest growth factor in the current economy. The problem with this at the moment is Political as at this point the government is the key player. Republican politics is hell bent to derail climate change solutions as the 2024 election moves into view. We may need to see many more Maui disasters on an even larger scale, maybe see Wichita burn to the ground. Then younger, more concerned people voted into Washington will bring the whole country on-board.
- Another input to all this, is the pressure that the market has applied to core economy Russell stocks. This is probably going to prove to be wrong headed as the consumer is becoming less of a discretionary buyer while core climate change type investments are on an upward trend. Things like insulation and heat pumps, etc.
- And lest we forget all the euphoria that AI stocks have received. As a early developer of machine learning AI systems for market analysis, I can tell you, it is not as magical as all the twitter AI posts make one believe. That to me means the Nasdaq 100 is overpriced vs the Russell.
- Analyzing the market here based on the comments above offers a number of choices. To put that into action here are some charts that provide a picture to the comments.
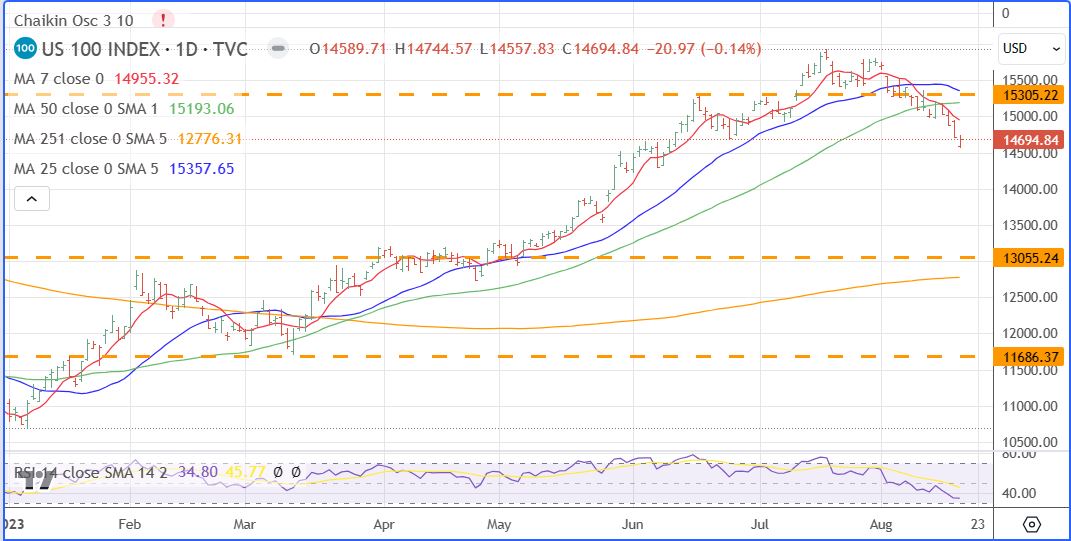
A. First the impending doom NASDAQ 100 chart. When it last week took out the June 26 low of 14687, a lot of negativity appeared. If one wants to pursue the bear story then a case could be built for a move down to the 13000 support area. On the other hand, if this is a Bear Trap, taking out the high of August 10 at 15072 would be a key trigger.
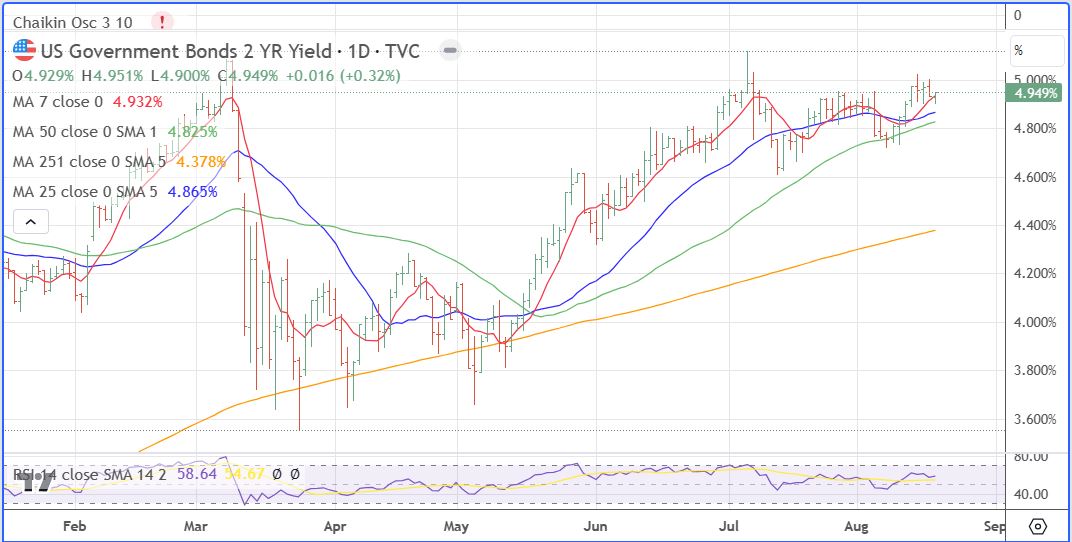
B. If interest rates are what drove the sell-off, one thing to look at is the 2 year rate, it is usually a good indicator of where things stand at the moment. What we see on this chart is a double top at March 8 and June 6 and no new highs. If the 50 day average rolls over I think talk of higher rates is over.
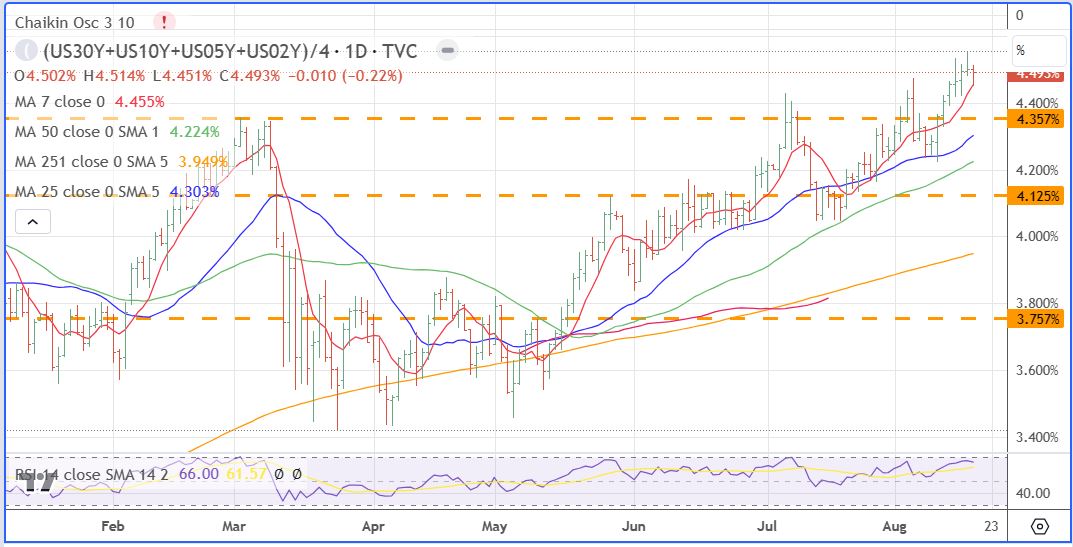
C. Some of the bearishness on the part of the pundits is reflected here in the average interest rate market chart. (the average of the 30Y+10Y+5Y+2Y). It has seen ascending highs from the perspective of March, June, and August points.
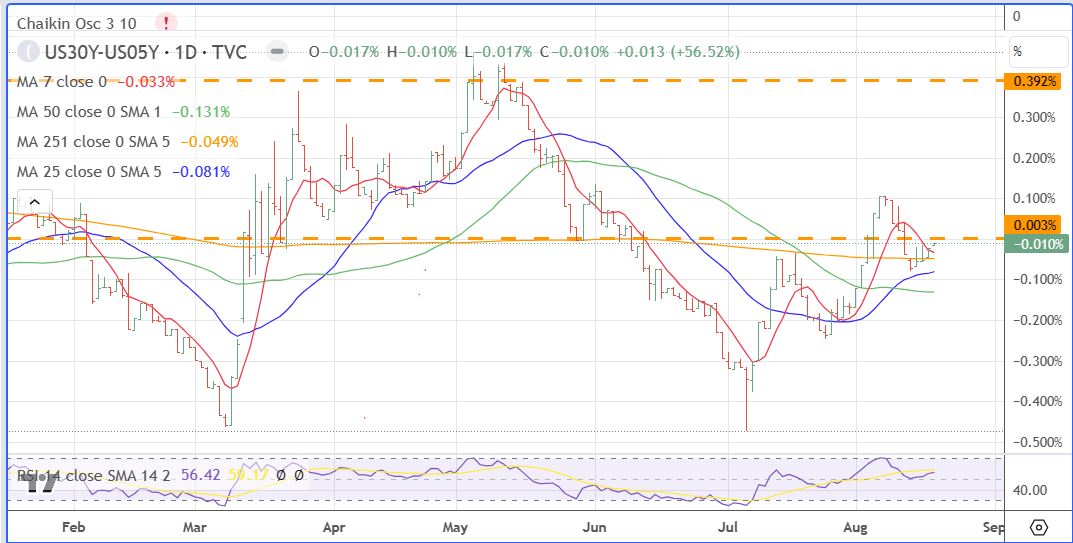
D. What comes back and puts everything about interest rates into perspective is what I keep talking about, Alan Greenspan’s favorite (tell the tale) chart, the 30-05 yr. It points to a normalizing of the rate structure with bottoms in March and July.
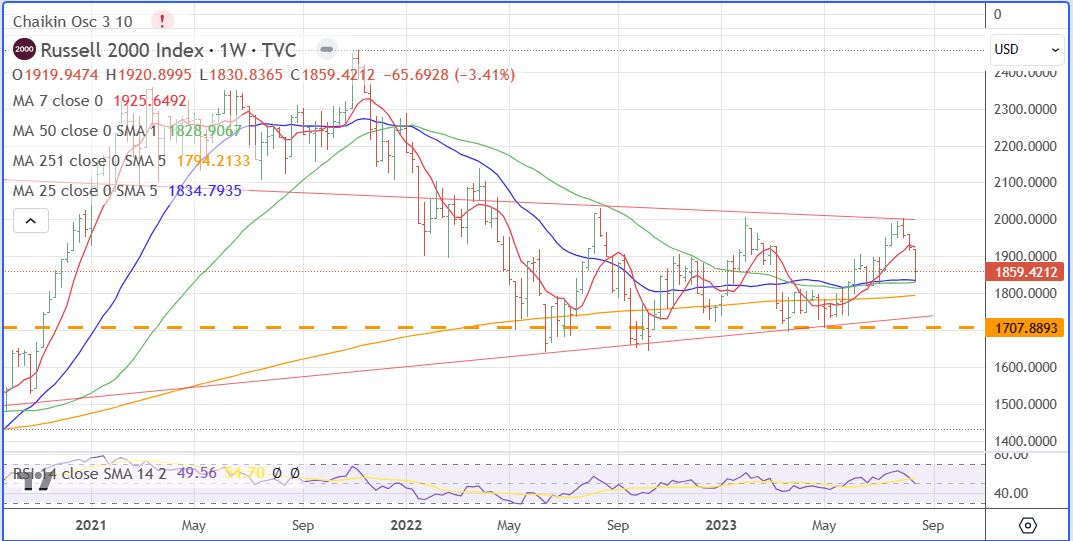
E. The Russell 2000 index chart RUT shows how the market has compressed that index. It started with the small bank crisis in March and then has continued due to investment dollars flowing to the AI euphoria and the various stocks and indexes that follow that drift. What you end up with is a market making a big wedge on the weekly chart. A breakout of this wedge to the upside will tell you a lot about the strength of the core economy. It may be a good indicator of when the recent meltdown of stocks is over.
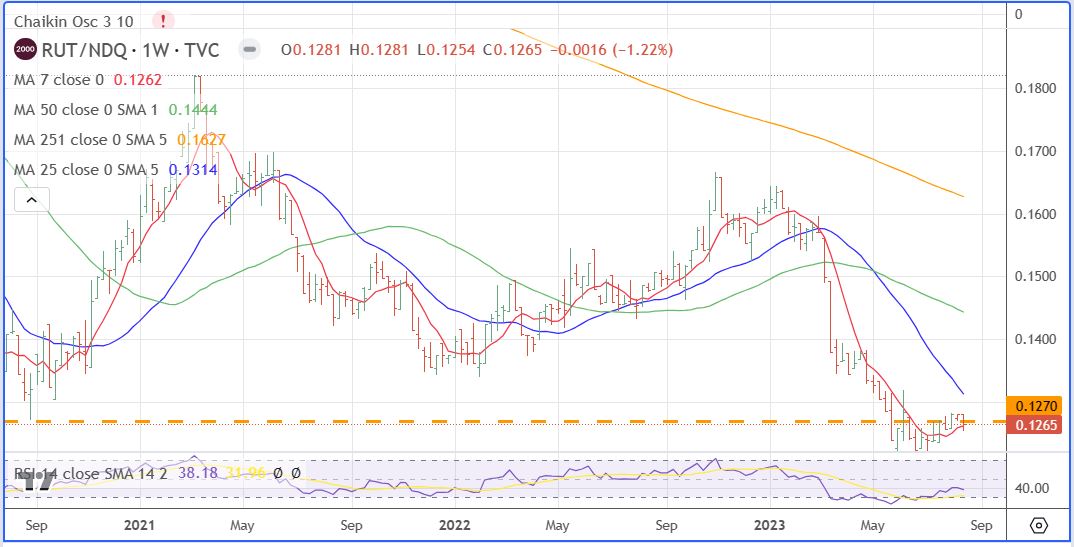
F. And lastly, following on the Russell theme and the over valuation of Nasdaq 100, here is the weekly RUT/NDQ chart that will be a big trigger for ending the Market Doom story. Over the last three weeks we have seen this ratio chart try to breakout to the upside
G. And of course, we cannot forget El-Erian and his focus on the China Troubles. It is a big country with big problems, so it is a risk to be monitored.
The Summary…putting all this together I see a lot of reasons to go with the Climate Tech model, covering hedges and putting EV and Solar positions back in place now. The key question is how fast does one need to act with Nvidia and Jackson Hole pending. We will take our time for now. The other option is to wait for more confirmation from other indicators shown here, so watch vigilantly.
Also, you may notice that this summer I have been trying to put out fewer posts, keying on Macro factors and letting the day to day volatility go past. This means I may have a significant post only every 6 to 8 trading days. If you would like information more often, email me at intrscop@mc.net and we can talk.
UPDATE AFTER NVDA EARNINGS…August 24, 2023
Settling Out. that is what we see the market doing now. NVDA hype is old news. AI will be a part of the New Economy but probably more as a facilitator. Our Climate Tech model is looking at the core economy, the Russell stocks to start to gain against the FANG and Nasdaq 100’s.
Leave a Reply