Let’s Try Again for Alan..
The move of the market away from consumer stocks into the Climate Tech area seems to be creating some confusion. Let’s not try to figure that out. So, let’s look again at Alan Greenspan’s favorite indicator of economic normality, ie, when the 30 year rate is rising vs the 5 year rate.
Here is the weekly chart of that relationship.
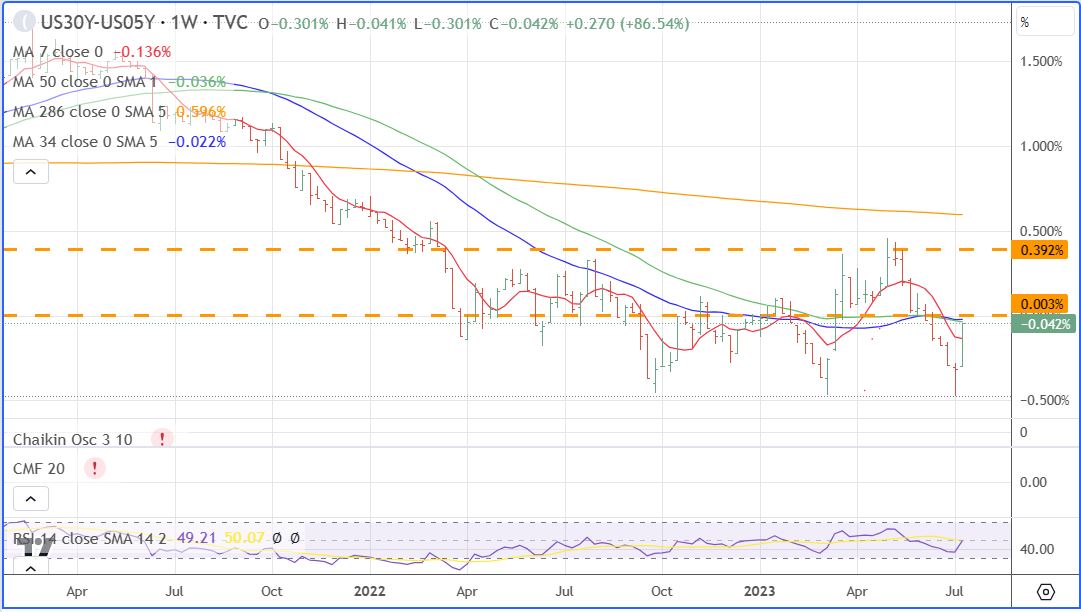
What you see here is a triple bottom, October 2022, March 2023, and July 2023. Triple bottoms tend to hold. Looking deeper, this relationship is near the magical 0.0 % line and when it takes out the May high of around 0.5 % you will know that the all clear for a bull market in stocks is starting. So be patient, all this action since May 11, 2023 is just the setup.
Leave a Reply