Mr Powell…
My view is goods inflation has been in the process of rolling over along with home rental rates. Services inflation is not going anywhere, it is in long term catchup mode. The FF trading high of 5.013 will probably be the high, today’s market basket rate of 3.755 should continue to rise to 4.125 area in early June. What is important on the chart here is the collapse of the Nov 2022 to Mar 2023 chart cup formation on March 20, 2023 and the forecast second half decline of rates.
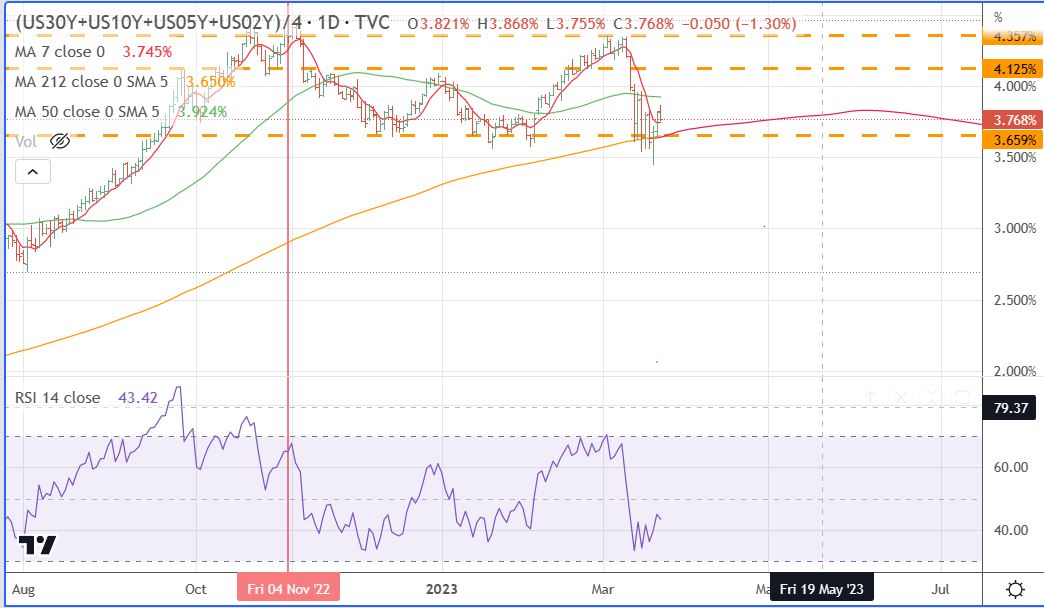
For me the anticipated rise in market basket rates going into mid-year is based on economic growth in core areas and Climate Tech. In the last half of the year I anticipate that gradual declines in inflation factors will take pressure off the rate market. What could come out of this scenario is an extremely long period of Fed Funds rate stuck in the 4.75 to 5.00 range as stability returns after 12 years of chaos.
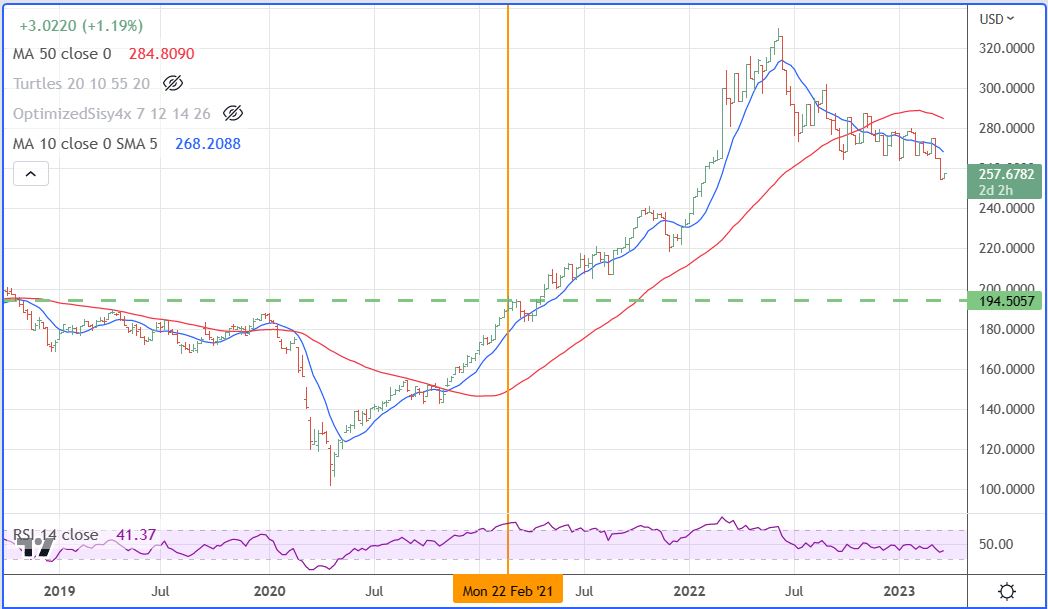
Commodity / Goods Prices 3-22-23 update of weekly data..
Below you can see how the core inflation risks have rolled over. Chart lines are 10 week and 50 week (one year) averages. It broke out to the upside two years ago in February 2021 as the combination of Covid freight woes and the Ukraine crisis played out. Those rates then topped out in June 2022 and are continuing to decline on a long wave basis.
Leave a Reply