The FED, Leader or Forcer
Over the weekend The Motley Fool said: “This Recession Indicator Hasn’t Been Wrong in 56 Years: Here’s What It Says Happens Next”. What they are talking about is the Yield Curve and here are their further comments:
“While there are a number of macroeconomic indicators that can be used to assess the likelihood of a gross domestic product retracement in the U.S., such as the U.S. unemployment rate and the ISM Manufacturing Index, it’s the Treasury bond yield curve that’s most often relied on as a harbinger of trouble to come for the U.S. economy.
In a healthy economy, the Treasury yield curve slopes up and to the right. This means longer-dated maturities (10-year and 30-year Treasury bonds) have higher yields than shorter-dated bonds (three-month and two-year Treasury bonds). Since your money will be tied up for a longer period, the expectation is you’ll receive a higher yield in return.
But when economic trouble and/or uncertainty are brewing, it’s not uncommon for this yield curve to flatten or even invert. A yield curve inversion, like we’re experiencing now, involves short-term-maturing bonds sporting higher yields than longer-dated Treasury bonds. It’s an indication that investors are worried about the U.S. economic outlook.
For the past 64 years, the Federal Reserve Bank of New York has used the Treasury yield spread between the 10-year bond rate and three-month bond rate to calculate the probability of a U.S. recession occurring within the next 12 months. Over these 64 years, the probability of a recession has topped 25% a dozen times and 40% on eight occasions.
With the exception of a peak probability of a recession of 41.14% in October 1966, the New York Fed’s recession-forecasting tool hasn’t been wrong if it’s surpassed 40%. In other words, if the New York Fed’s recession probability indicator surpasses 40%, we’ve had a recession within 12 months, without fail, for more than a half-century. In December 2022, this recession probability tool hit 47.31%. That’s the highest reading since 1981, and a very clear indication that economic activity is expected to slow at some point in 2023.”
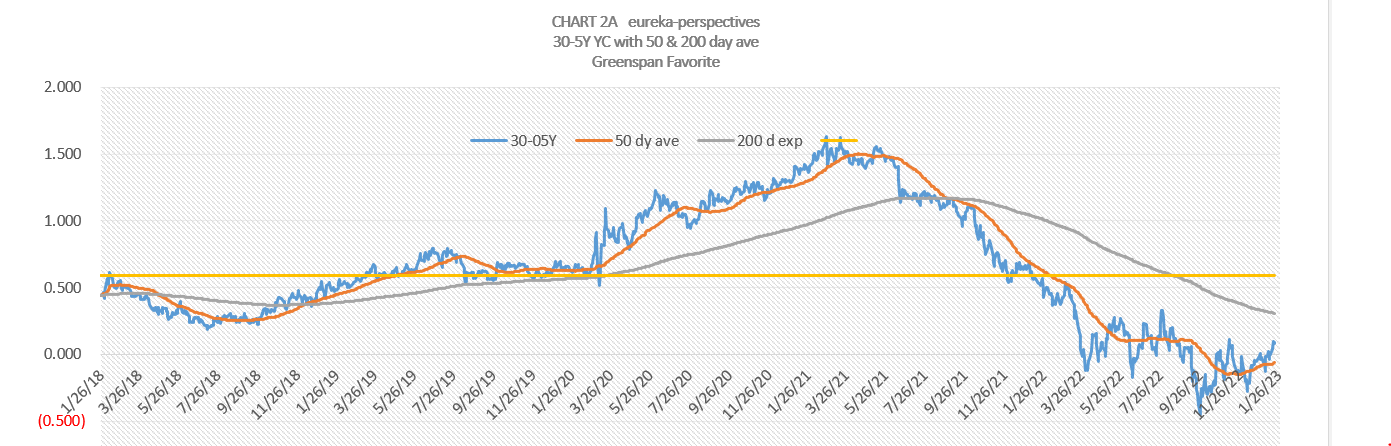
With all of this said, we now can think this through and maybe put some things in perspective. Former FED Chair Alan Greenspan often said if you want to see what is going on in the economy, you need to look at the 30 Year to 5 year yield curve. Using this indicator one can see the picture out five years from where the FED is trying to act. As mentioned above by the Motley Fool, the FF rate and the 2 year rate are highly tied to FED actions.
More importantly is whether the FED is trying to Lead the economy or to Force the economy and may not be due to what is asserted by most commentators today, i.e. “It’s an indication that investors are worried about the U.S. economic outlook.”.
Here is the 30-10Y yield curve chart from our files. On it we have the important 50 day average. You can see that the curve bottomed on 9/26/22 and the 50 day average turned up on 11/26/22. What this says to me is that the economy is sending out signals that things are improving.
Over the Past Week…
We have shown charts illustrating how the FED is bumping into a wall with the FF rate and while they will probably try to use Rhetoric to talk about how tough they are prior to the FEB 1 Fed Meeting and how they are going to raise rates a 0.25 points, they essentially are done and the market will eventually take over.
Leave a Reply