A lot is Happening Today…
I will post some updated chart relationships at 9:30 AM CDT, one hour after the market opening. Some things that jump out to me are: 1) the China market action this week, and 2) the combined chart made up of the 2 year note, Short dollar ETF, and the S&P Index.
Here are the updates:
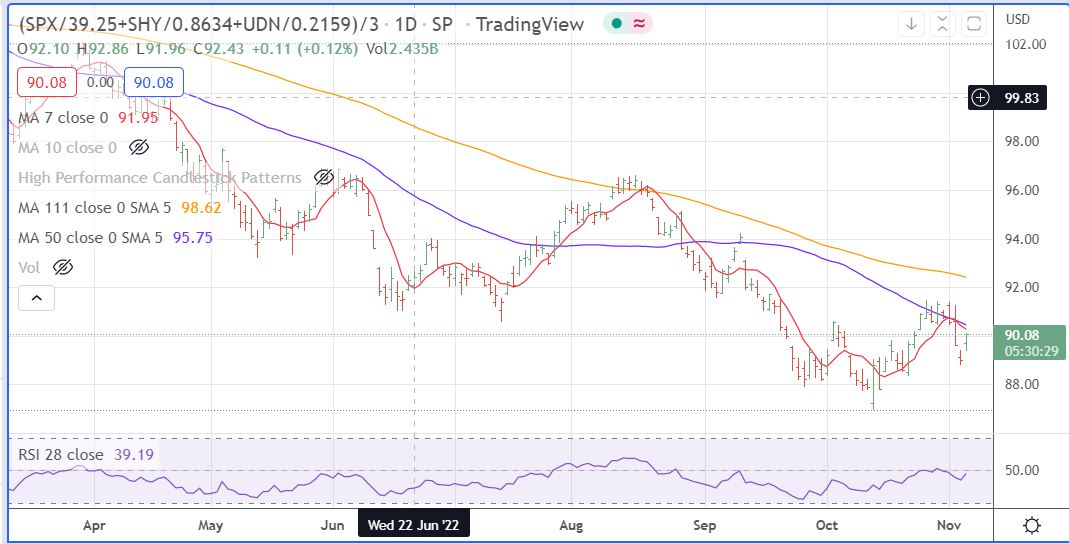
- First, here is the key indicator that I watch, the composite chart (indexed to Feb 2021) of the 2 year note ETF SHY + the Short Dollar ETF UDN + SPX.
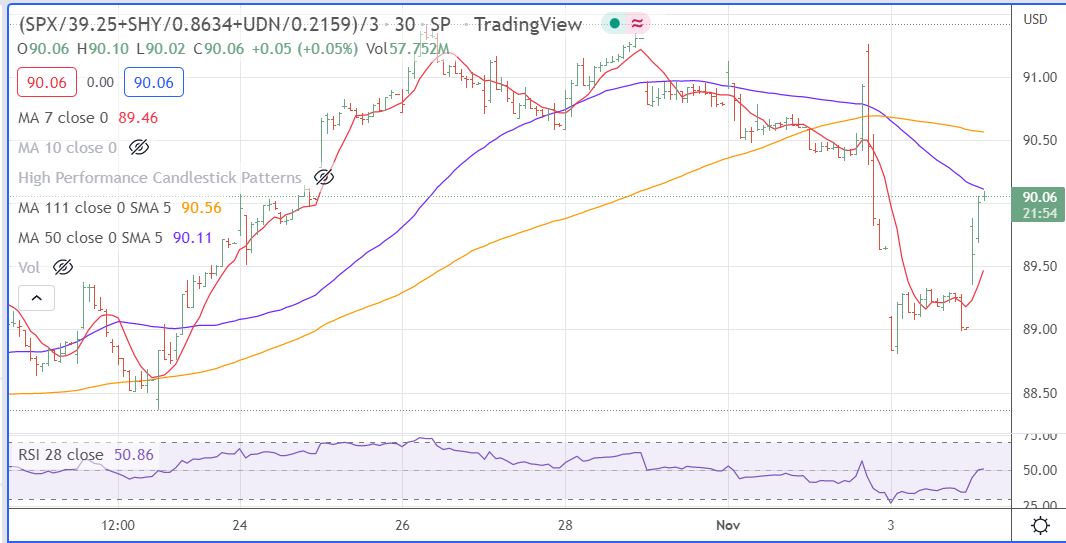
- The top chart is the daily chart through 9:30 AM today, it has left a one-day island based around the Powell Scare Rhetoric. The next chart uses 30 minute data points.
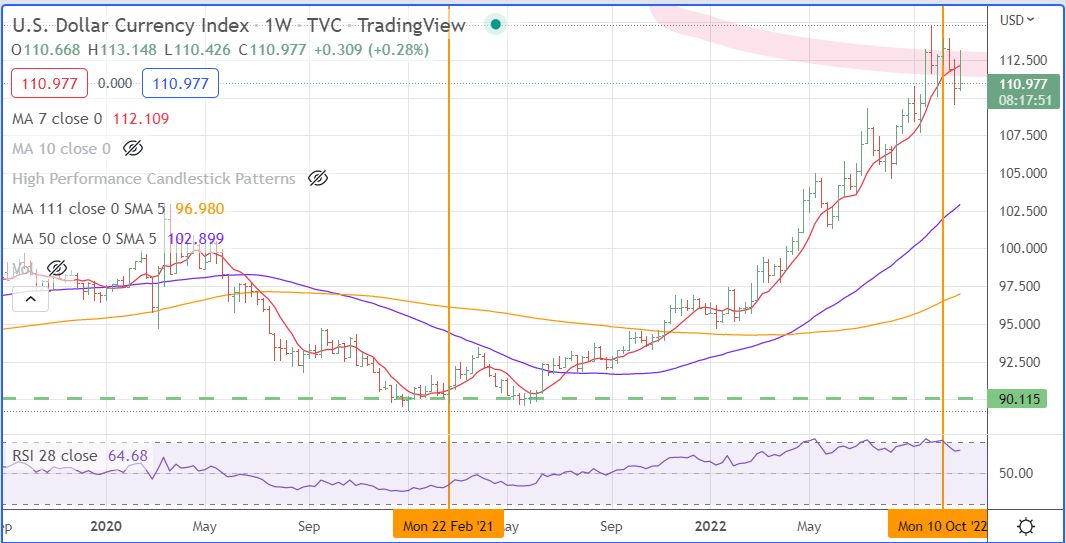
- And next here is the important weekly dollar chart with the vertical lines which we have used to indicate important weeks where we have identified turns. Trading under 111.70 is for me a bearish signal on the dollar. The election next week should make the move accelerate.
Leave a Reply