Saturday Check-IN
Updating our sector sort numbers for a little perspective this morning.
First a couple of comments, the low of the total market valuation chart that we shared on 9/27/22 and showed the bubble had been punctured was pressed yesterday with lower stock and bond prices, but the other factors held and the total held slightly above lows. I view that as important. I still feel that that chart says the FED pressure IS OVER and all we are getting now is rhetoric.
The variance between interest rate pairs 30-10, 10-05, 05-02, 02-3mo, is still very low. This signifies to me that rates do not see direction from here, they are in overkill territory. And the YC is of no value with the FED creating a totally artificial environment.
Another thing I watch on rates, high risk bonds vs other rates including corporates do not show relative stress in the high risk area, which to me nullifies all the bad stuff the bears are saying. Also, the TIPS are seemingly losing favor to other bonds, especially the 10 year.
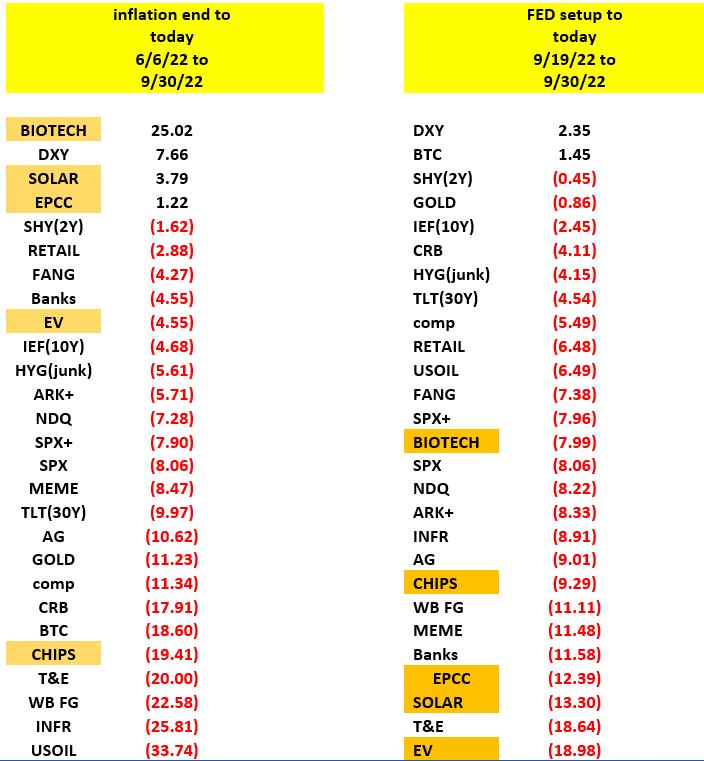
And here are the sector sort tables sorted to show how our New Economy Climate Change Model is doing vs the other sectors of the market. We look at two periods, first the period when inflation stopped vs today, the important period where total performance in key. Secondly, we show performance for the last ten days, the period where the FED is desperately trying to kill the economy to halt inflation. They are behind the curve and if Biden had any spine, he would walk into the FED and ask for Powell’s resignation.
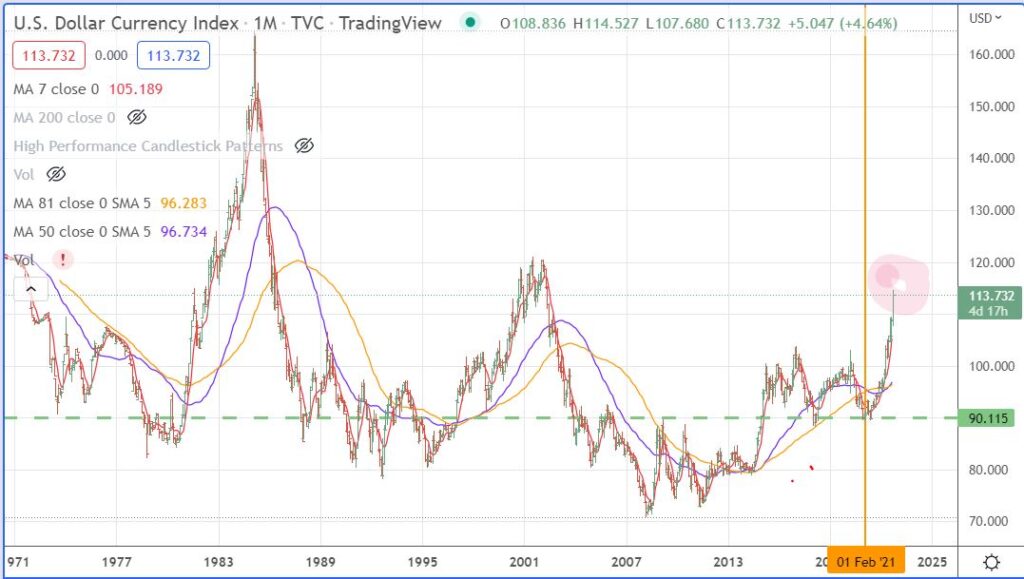
And don’t forget, the dollar. Here is what we said early this past week.
Back on May 19, 2021, see archives, we outlined a view of the dollar and put a red circle on the chart in the 113 to 119 area as an objective.
Leave a Reply