The Bubble and the FED
The central factor in the markets for the remainder of the year is how tough is the FED really going to be if some key inflation factors roll over. By my reading of the total economy charts, which sum up trading values for stocks, bonds, commodities and precious metals, we are still in the bubble. With the economy still in the bubble, there is a high probability that stocks will make new highs, especially if the Democrats pull off a big save and increase their majorities.
Here are two charts related to the above statements:
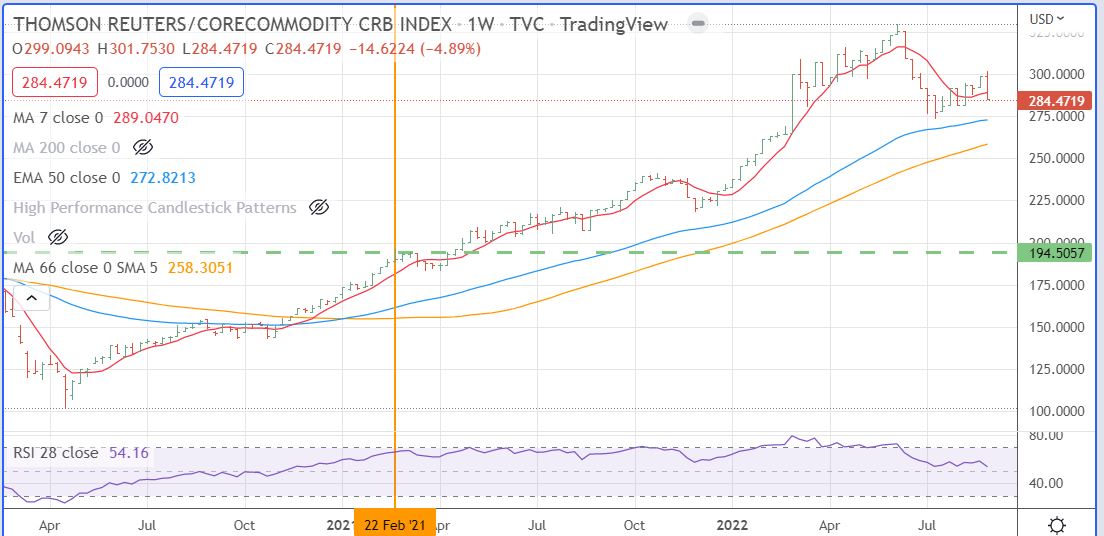
- First here is the chart of the CRB Index of commodity prices, (39 % petroleum, 41 % Ag commodities, 20 % various precious and non-precious metals). This chart uses weekly data and shows a big outside week and lower close as of last Friday. I would say that is a bearish vibe on core inflation factors.
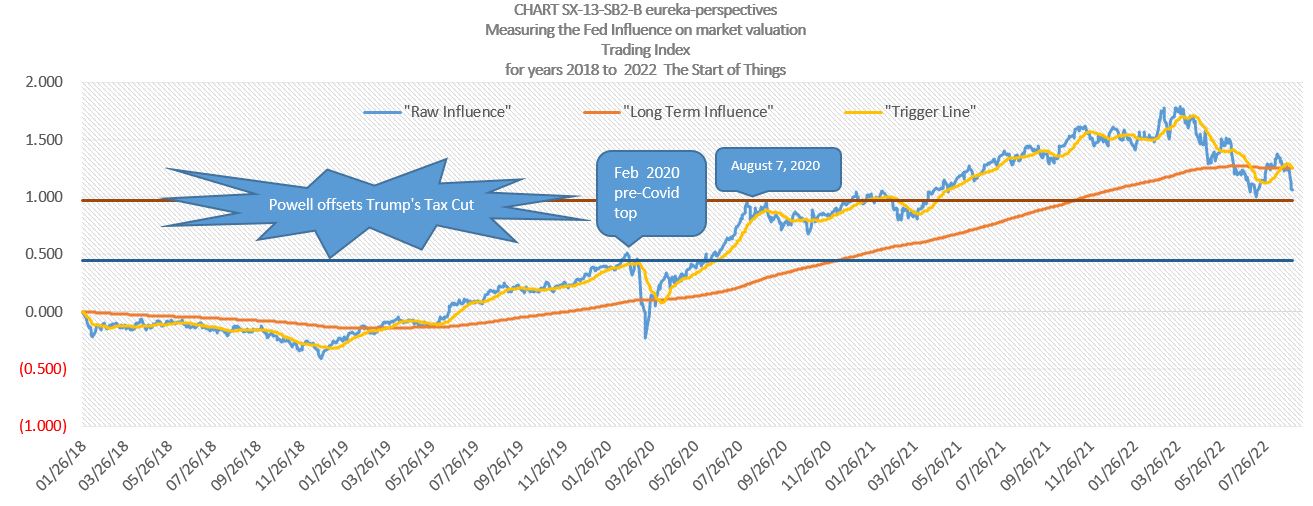
2. Next is a chart that shows the total economy value and where we stand versus the start of the Bubble on August 7, 2020, the date when we pressed for the FED to stop throwing money on the fire. You will note that the market convulsions of this year have stayed above the August 7, 2020 line in spite of massive FED follower shorting. We are at this very time seeing the shorting at a peak level and this coming week going into the the next FED meeting should provide major fireworks as core inflation wanes and forces shorts to rethink their positions.
Looking back to my approach to when the total economy charts peaked amid the FED’s attack on inflation by destroying the economy was to be short for the initial burst with 3X short ETF’s, trade the initial bounce with leveraged long ETFs, and then starting on May 11, work to put together a portfolio of stocks that will be part of the growth part of the economy going forward. The idea has been to work around the biggest theme, climate change with EV’s Solar, and chips at the base and add in pandemic fighters with bio-tech. That has worked well through what I believe was the May 11 to June 16 bottom in the stock market, and no doubt positions were helped by buying during the falling knife days.
Going back more..
Looking back to all my blogs on the FED and the bubble which got its early start in 2011 and then was really filled by the Powell FED in recent years. I now am realizing I need to take a different view on this phenomenon; the Bubble is not so much the problem, the problem is the forces that I suspect created it and move money around within it, the FED and associated partners with special working relationships with the FED. BlackRock is probably the most prominent, here is what it says on its website: “The Federal Reserve has turned again to BlackRock. The nation’s central bank said it tapped BlackRock, the world’s largest asset manager, to help oversee the Fed’s efforts to stabilize the bond market amid the economic turmoil caused by the coronavirus pandemic.” The net effect of all of this is that a bubble was created when the FED followers pushed asset prices to unrealistic levels and now this same group is trying to take money out of the economy on the short side.
So, to paste some more pieces to the puzzle, here are a number of charts, probably too many, but this is an important juncture for the market as inflation starts a tumble. (you will note that most of the charts start with 1/26/18, the date I call the Economic Fracture date based around Trump’s tariff and Fed pressure behavior).
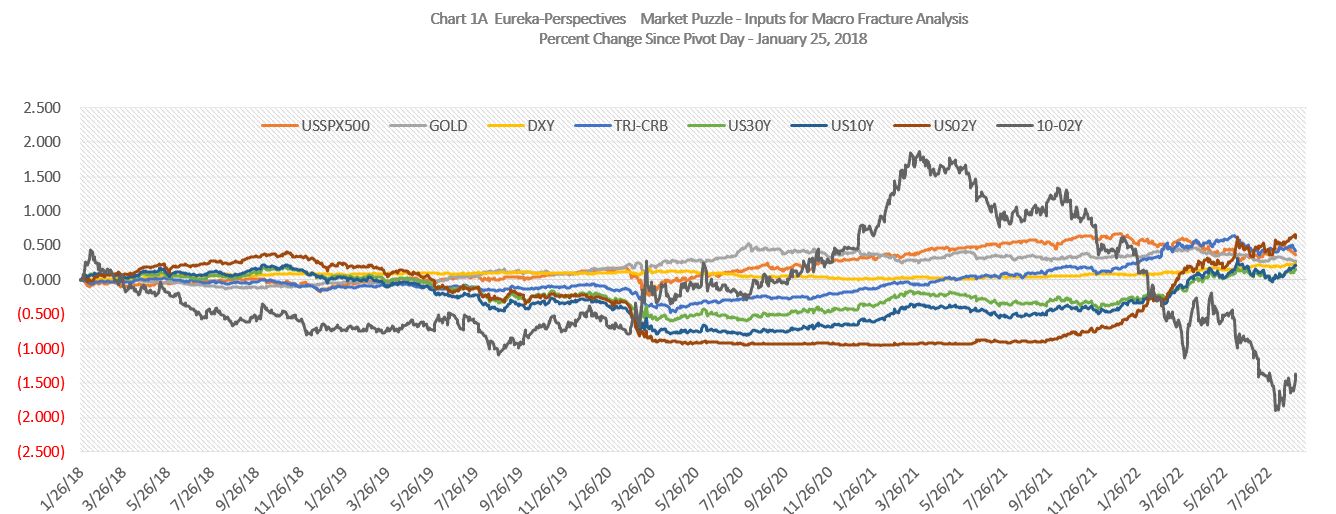
3. This first chart is what I call the Puzzle. I am not sure what it says, but it is a picture that shows the various indexes, which started at ‘0’, have seen a lot of divergence, and except for the 10-02 YC are coming back to a level of relative correlation.
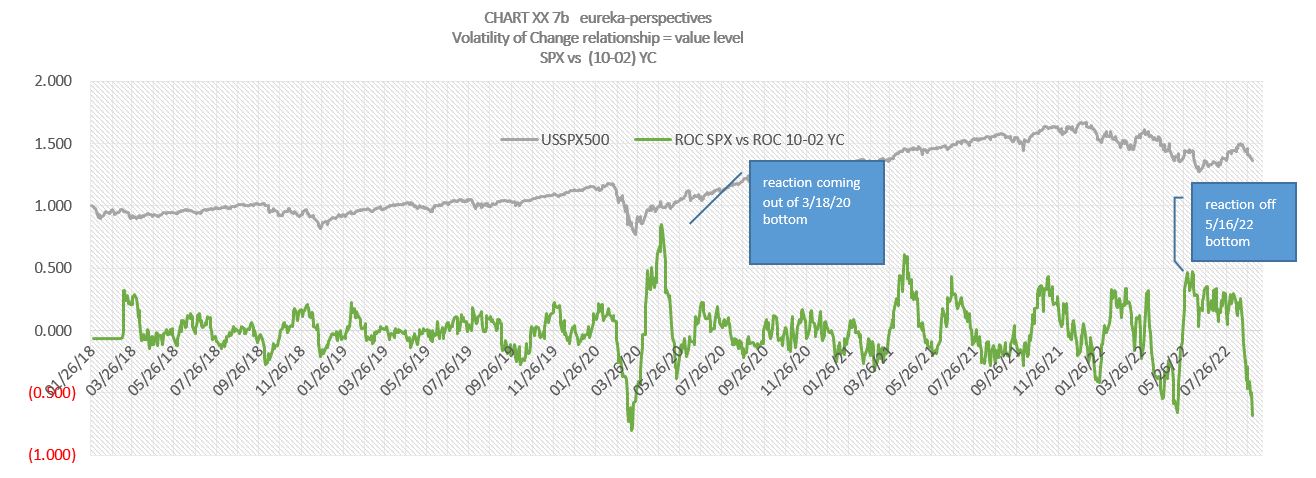
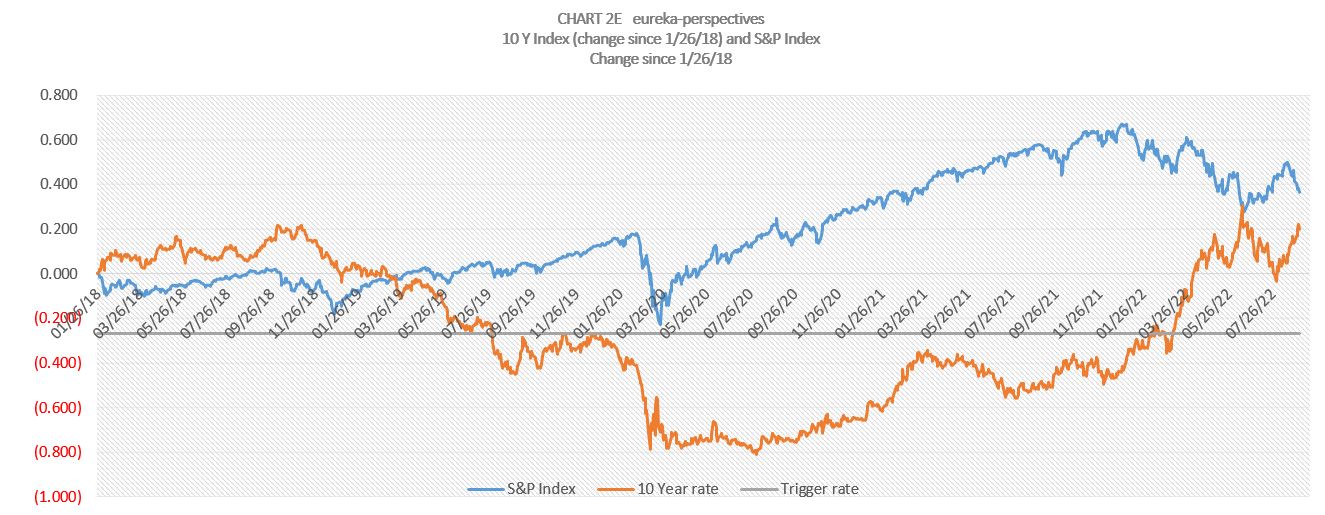
4. The next chart is is one I present frequently, mainly because it helps me to time major reflex situations, it is the second derivative ROC value expression using 10-02 YC and the S&P. Basically, the chart shows the potential now of a major rally in S&P from right here.
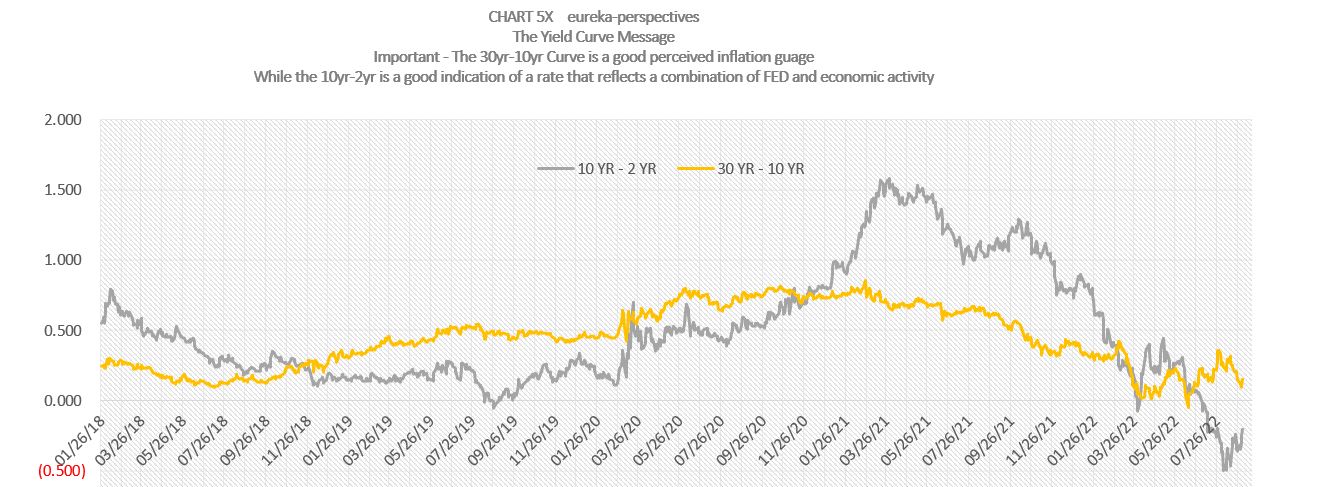
5. The next chart shows both the 10-02 YC and the 30-10 YC. I tend to view the 30-10 YC a reflection of long-term inflation factors, which ironically have been declining as all the action has been short-term FED Fund based, And to me, I view the 10-02 YC as a reflection of short-term operating stability. To me the 10-02 shows stability building.
6. This next chart is kind of a fun chart, I am not sure whether it is important or just a coincidence. You will note the two lines briefly touched on May 11, 2022.
In summary, with all this said, all of us traders know that the best of plans can be wrecked by an outsized bully in the form of the FED and its followers.
Have a good week, I am going to be on vacation through the FED meeting but will try to link in remotely occasionally.
Leave a Reply