Sunday Afternoon, Playing with Numbers
I am having a little fun this afternoon. I went to the trading screen and ran some numbers show relationships between 2-year interest rates and each of the main three indices, S&P 500, 30 year bonds, and CRB commodity prices.
The starting point I used was the start of the infamous Ben Bernanke FED on February 1, 2006. I then converted the prices to an index of 1.00 on Feb 1, 2006. I then divided each of the three market indexes by the indexed 2-year interest rate. The starting numbers on that date are: US02Y 4.737, S&P 1281, TLT BONDS 91.35, CRB commodity index 304.95.
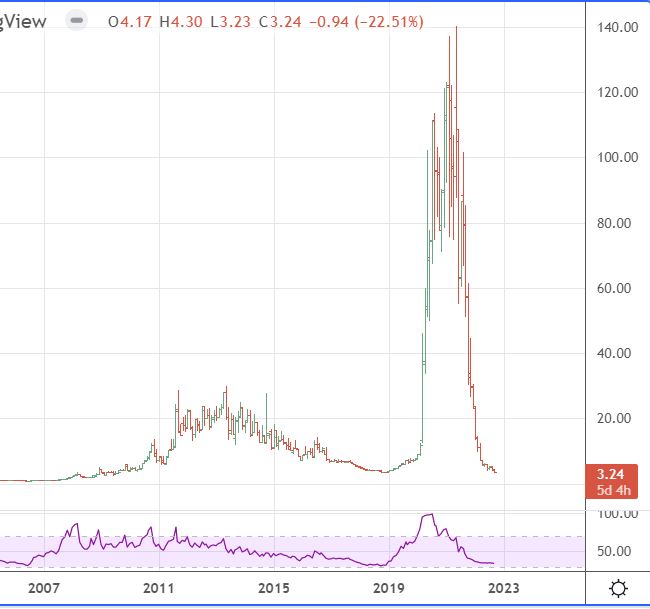
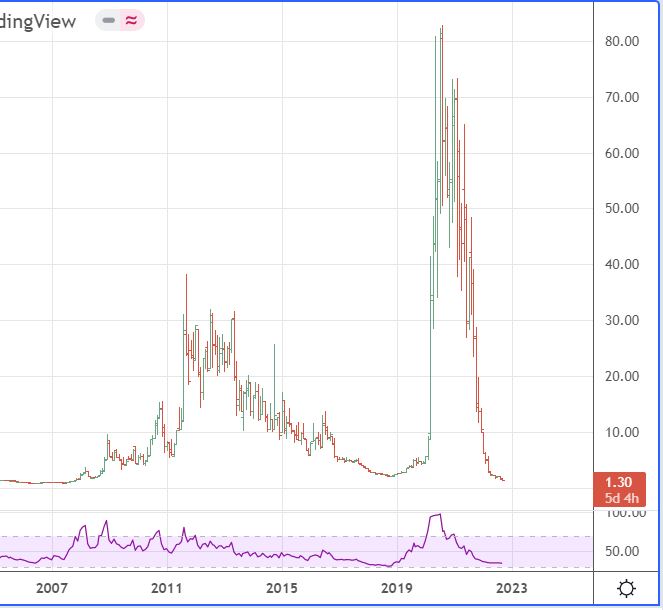
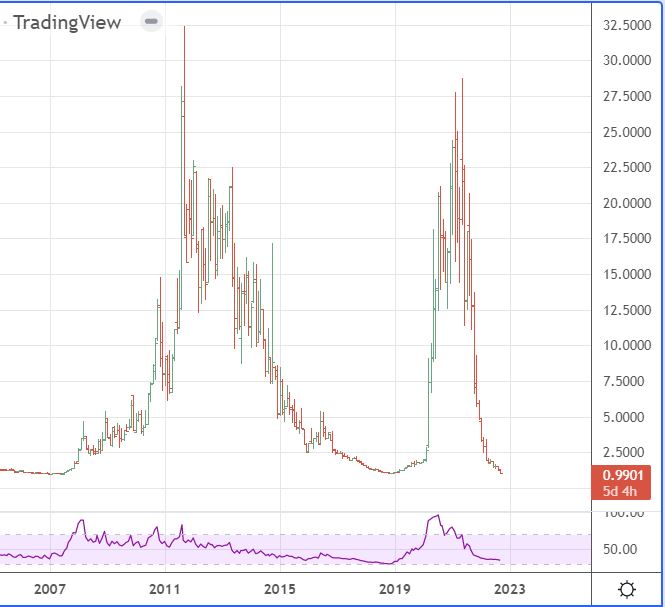
The end result are three charts showing how the S&P, Bonds, and commodities divided by the 2-year interest rate acted over the past 16 years. The index ratios tell the story, S&P started at 1.00 on Feb 1 2006, peaked at 140.4 in May 2021 and are now at 3.2. Bonds also started at 1.0, peaked at 82.7 in Aug 2020 and are at 1.3 today. Continuing, commodities also started at 1.0 on Feb 1, 2006, due to a shorter cycle peaked twice, 32.4 in Sep 2011, and 28.7 in May 2021 and are now at 0.99.
In summary, the macro picture would suggest that in terms of commodities, Powell has punctured what Bernanke started, and bonds and stocks are not far behind. This could be the fitting end to the infamous Bernanke-Yellen-Powell legacy. One final note, these charts may not have value in terms of investing decisions but do show how much the FED whips things around irrespective of economic numbers.
First is the S&P / US02Y
Next is the TLT Bond/ US02Y
And then the CRB Commodity / US02Y
Leave a Reply