A Story in Charts…
A little late to post today. Kind of wanted to see things develop. I am still committed to the belief that the 5/11/22 to 6/16/22 time period is the basing time period. This is taking some time to shakeout as market players react to inflation news with each new PPI, CPI, and PCE report.
The New Economy is developing..
I still am looking at the economy that rises from the ashes of this first takedown of the bubble. It includes stocks in the Practical TECH, EV, BIO, and Medical areas. As we researched stocks in these new economy areas, we started out with some core stocks and have built a total of 4 mini-portfolios to date.
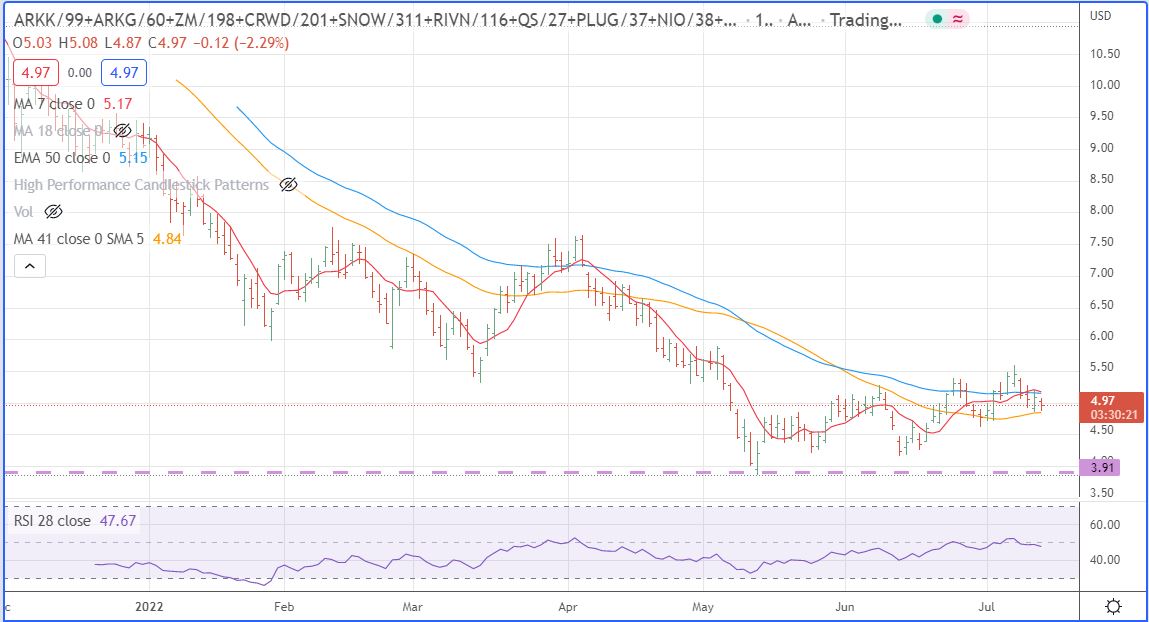
The first portfolio covered a broad area as it includes two of the core ARK ETF’s, ARKK, and ARKG, plus SNOW, RIVN, QS, PLUG, and NIO, obviously a slant to EV stocks. As of noon today, this portfolio has weathered the bottoming process and is slowly gaining ground.
The second portfolio and chart includes stocks with a focus on biotech and medical areas. it includes stocks FATE, VCYT, CERS, VRTX, INCY, MRNA, and VIR. It has done exceptionally well coming out of this bottoming period.

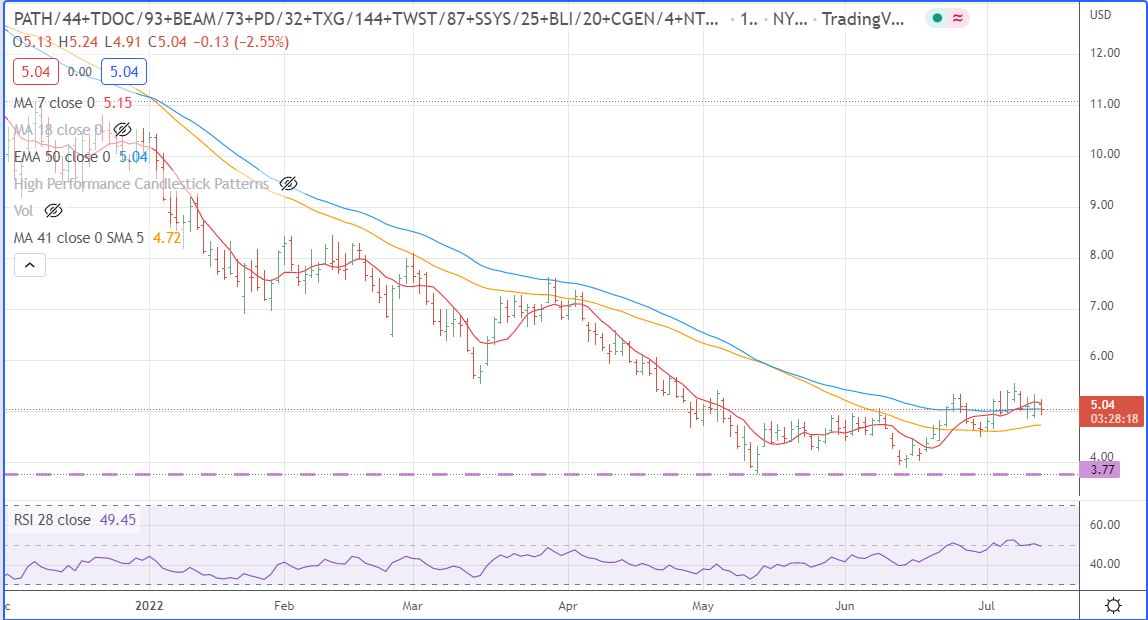
The third portfolio and chart is devoted primarily to Biotech, medical diagnostics, and robotic stocks. It has PATH, TDOC, BEAM, PD, TXG, SSYS, BLI, and CGEN.
And the fourth portfolio and chart is made up of what I would call hot biotech kind of companies, CRSP, BEAM, NTRA, FATE, DNA, TWST. They have been acting well also and some of the stocks are included in the other portfolios.

Going beyond the New Economy…
Inflation, interest rates and how key indicators are faring are covered here.
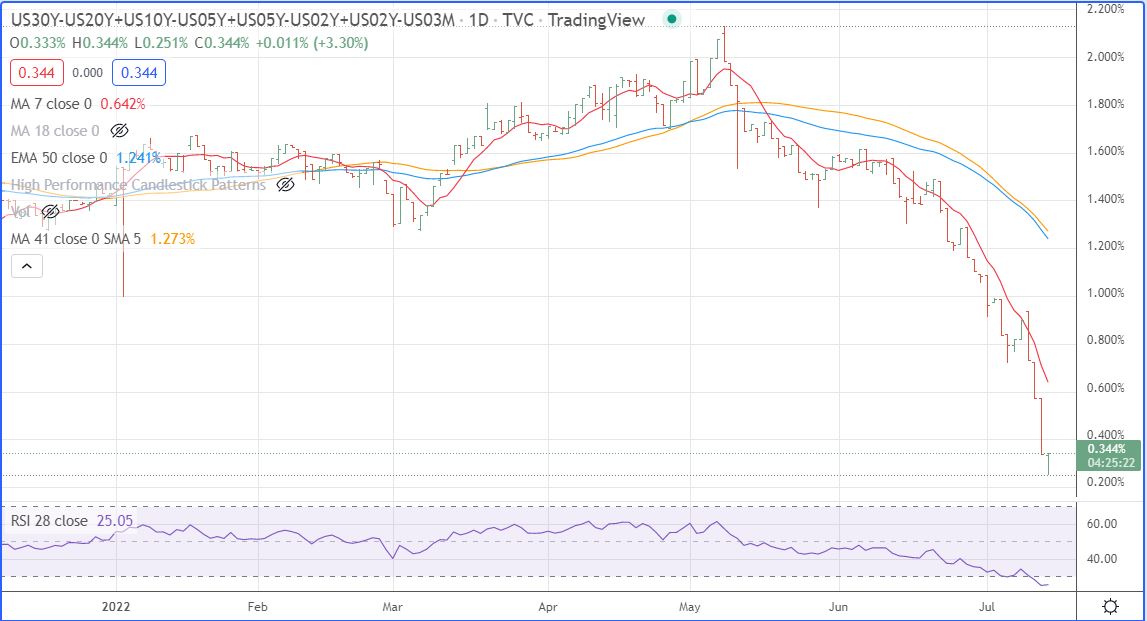
First is the chart that I like to follow to see how much depth there is in the marketplace as to interest rate direction. I have show this chart before, it simply adds up the differential between the various yield curves, to me the less differential, the less market conviction. Today we are at the lowest level since the key May 9th rate implosion. The calculation is a sum of: (30yr-10yr)+(10yr-5yr)+(5yr-2yr)+(2yr-3mo). The market is clueless.
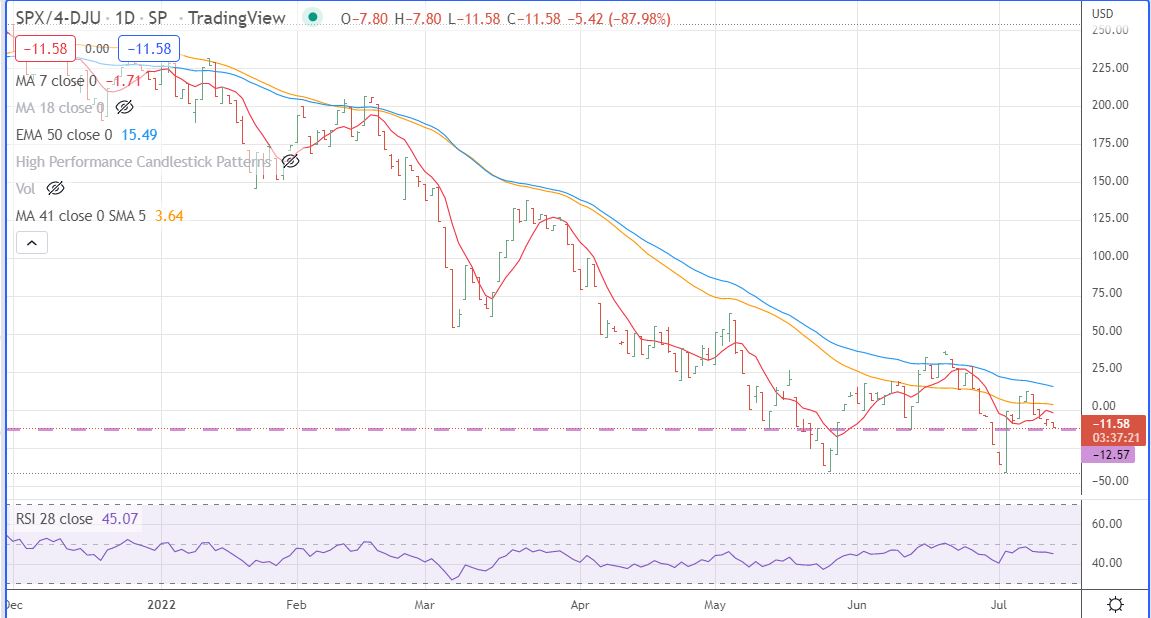
One other chart that I have presented before, and that is the S&P vs DJU which tends to call bottoms. It is in the bottoming reaction phase.
Leave a Reply