Oil is Hanging On
A little update here, I am holding on to my 20 percent oil position, but I do have to admit that the premise is being tested. I recognize that the crowd that built the stock bubble in 2021 is behing the current oil bubble, and they have a lot of money.
Here is the short-term chart that keeps the topic front and center, the semi-conductor ETF SMH vs oil sector ETF XLE. A few days ago I posted both the long term and short term chart of the relationship.
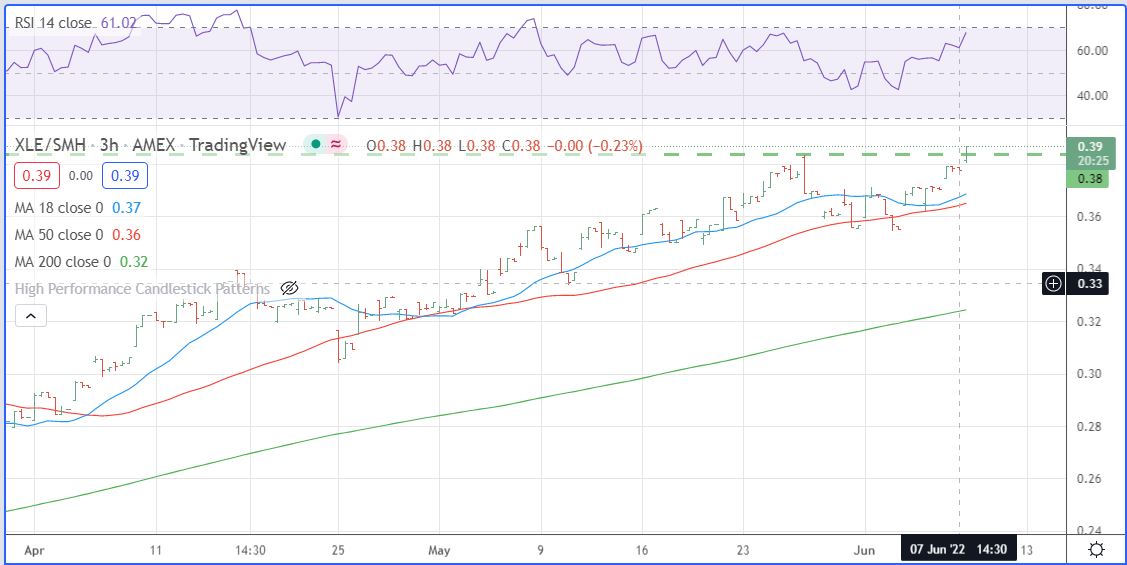
We see that XLE vs SMH has made a short-term high today, so I am watching this intently. Kind of a double whammy today, XLE up, SMH down. Keep in mind this is a 3 hr relationship bar chart and RSI has been making a series of lower highs.
On other matters, the tentative rally in stocks, especially TECH since the May 11-12 bottom continues, but all eyes are still on the CPI and FED meeting.
Leave a Reply