Free Markets….with mid-day analysis on 30-02 Year rate curve and what it points to..
The fight for free markets is on, the Fed is fighting to maintain its role as God. Yesterday was a shot across the bow, and today is the return shot, this will go on for a while.
The trend of the 50 day average is always a barometer of resistance if one is trading against it. Obviously the 50 day is still down. This always occurs in early stage moves. As I mentioned yesterday, the rally was driven by short covering. Speculative money usually trades with the trend and is usually the Big Money and in the artificial markets that we have seen over the past 11 years, trades with the FED.
I just deal with it.
Mid-Day Look at an interest rate Decision Maker
The interest rate markets reveal where we are in the fight against inflation and we are seeing a big change evolve over the past couple of days as the 30 year rate is acknowledging inflation and indicating that the 2 year rate has done its job..
Here are two charts, the all-important 30Y-2Y relationship, with two time frames, ie. weekly data, and daily data.
This first chart is the chart using weekly data that allows a big picture view. What this chart shows is that the 50 week average turned down on October 11, 2021, 2 year rate was 0.397 %, today the rate is 2.732 %.

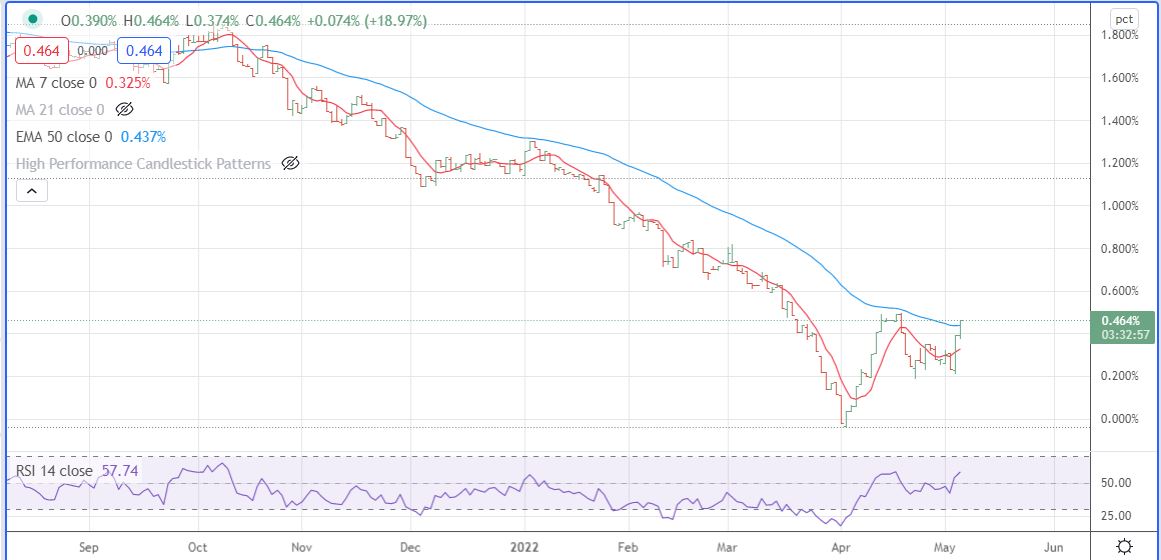
The second chart is using daily data and provides trading related input. Today we are seeing an early indication that market reactions to the 2 year rate are about to change as the yield curve is crossing the important 50 day average.
Leave a Reply