The Big Crash
Before I get into my analysis of the Current Market Setup I would like to review how we got to this point.
As long-time readers know, I have been talking about how an abundance of FED action starting with QE2 in 2011 would at some point end in a Crash. I still have that view. I also have pointed out my view that the Big Crash would come as a result of a failure of the FED being able to correct their actions.
In many posts I had pointed out that there was no way to know when the market top would be hit, and a downturn would ensue. I tried to maintain a certain amount of discipline and just add to shorts over an extended period of time, only trading out of them in December 2018. Mar 2020, and January 2022. In all cases, after a rally I reinstated the shorts until the January 2022 trading bottom when I exited all short stock positions.
Starting on January 25, 2022, I moved into a short- term trading strategy in order to digest the top we had seen and see where things would go next. This kind of volatile trading has not really been my style since maybe the 2008-2009 crash or for sure after leaving the CME Trading floor in 1980 after ten years of floor trading. The trading during the past three months has been on the one hand exhilarating, and on the other hand tiring. but it has been fruitful, as of earlier this past week we saw trading accounts up 30 % during the period, not too bad considering that I was using 3X leverage vs the 20X leverage we used on the trading floor. I then this past week determined that the trading range was ending and the markets were ready to make a move out of the range.
The driver for this determination was a number of indicators that I follow. No doubt there was a back story of trading exhaustion and also a realization that it is time to spend less time at the screen as our organic garden needed some attention with plating time approaching.
In any case, on Thursday and Friday it became apparent that the market still had another trading move before a breakout would commence. As numerous analysts have pointed out over this weekend, the market, while still being within the SPX 4150 to 4662 outside range, is on its heels, oversold, and poised either for 1) a bear market breakdown, 2) a dead cat bounce, or 3) an unbelievable retest of the highs.
Lets get back to basics here..
At this point I will go back to my opening paragraph, I don’t believe that the Big Crash will occur until the FED makes a mistake in trying to undo the stimulus. So far all it has done is talk about what it is going to do, and yes through its followers ( I could say its closely tied manipulators) it has created a lot of movement in interest rates, the yield curve, and stock prices, especially the wildly overpriced FANG and what I have long called the Wanna-Be FANGS during this staging period.
Next, let’s look at the Seven Charts… Background Story…
First, as the FED enters this wind down stage, we probably should be looking at the long-term implications of some 12 trillion dollars of COVID related Government Spending and Stimulus plus the 5.0 Trillion dollar increase to the 4.0 QE2 FED balance sheet since February 2020. A lot of this was obviously needed but there is no question that a lot of it is still sloshing around and what I hear is much of what was called loans has been or will be forgiven. With Washington tied up with the Jan 6 Treason trials, there is probably little of this that will ever be investigated.
So, we have money sloshing around in what I see as a funny money asset bubble where one month the big money players are running up stocks, the next month they are running up commodities, and then are always bonds to short or to buy if they get cheap enough. And now they are trying short stocks. they whole package is so lucrative that no one needs to Buy gold and Silver, and then there is the Bitcoin Ponze scheme running on the side.
Through all of this interest rates and the yield curve has been the focus of the media and pundits. This is ironic, as the problem creating the inflation, in my analysis, is totally the Balance sheet and government stimulus, if you have enough play money already, why worry about borrowing more? So, unless the FED gets aggressive and takes the Balance sheet back to August 2020 levels, (which will take around 2 years of QT at the advertised 95 billion per month rate) and the government gets aggressive in getting back some of the COVID related loans, there will in my view need to be some waiting time for the Big Crash.
Next let’s walk through some charts that illustrate the story and maybe provide some clues……
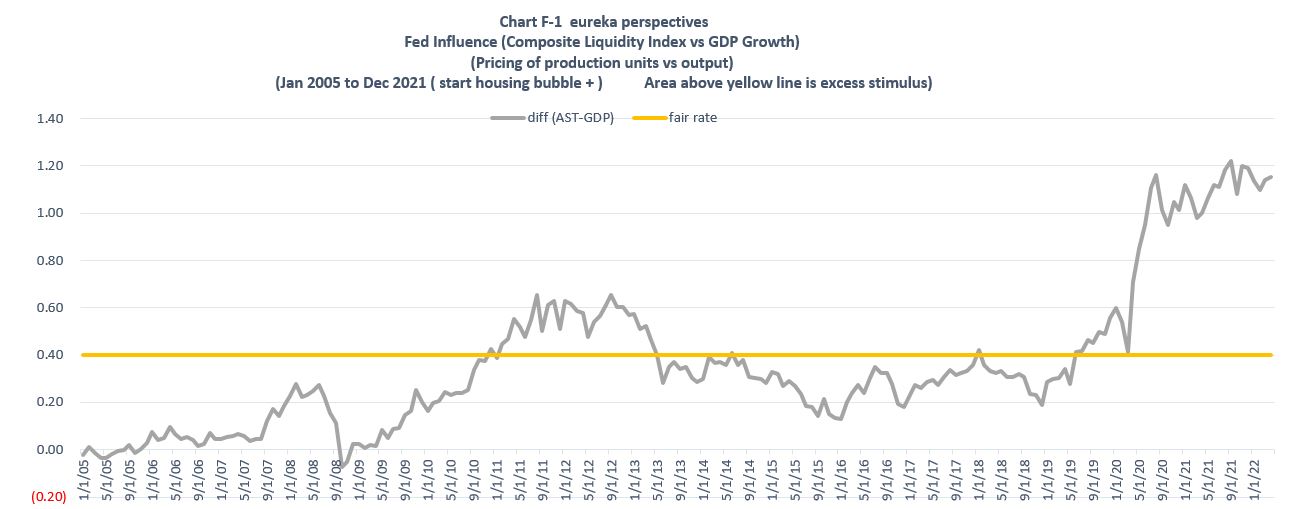
- The first chart is one we have posted many times but here is the updated through the end of the first quarter 2022 version. It shows the influence of the FED Balance sheet and stimulus and how the great measuring block, GDP, relates to the Fed Balance sheet numbers. What you see is how high asset prices are versus GDP. The dilemma here is determining whether our economy has become addicted to FED and Government stimulus so much so that it cannot be let down without a Crash that would make 1929 seem like a fairytale.
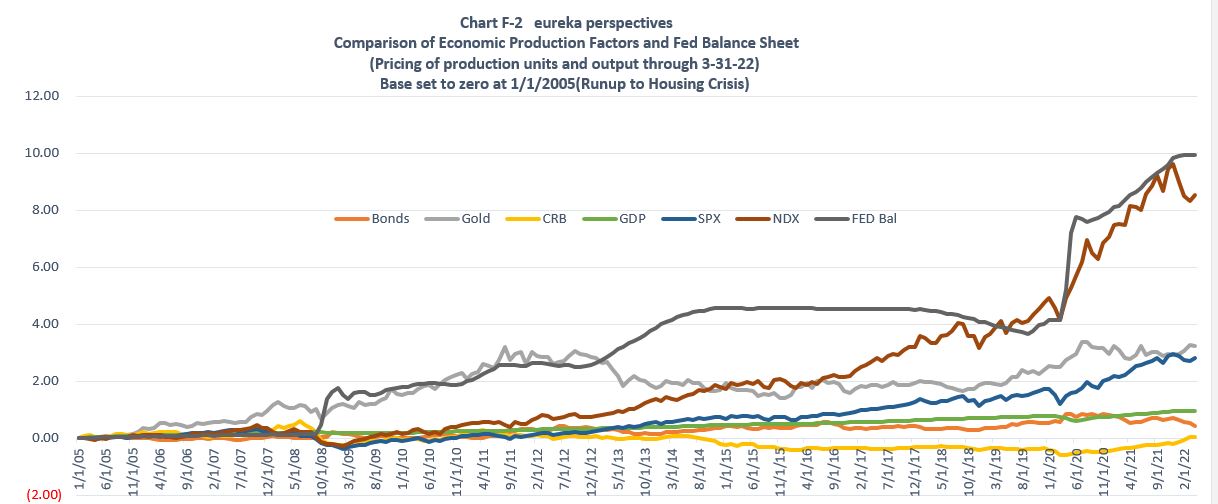
2. Next let’s look at asset prices vs the Fed Balance Sheet. What jumps out here is that the NASDAQ 100 has benefited by far the most in the uptake of FED stimulus. The very top line in this chart is the FED Balance sheet, the number 2 line is the NASDAQ 100. You can see commodities are trying to catch up, but they are far down the line. (keeping in mind this chart and the one previous go back to 2005)
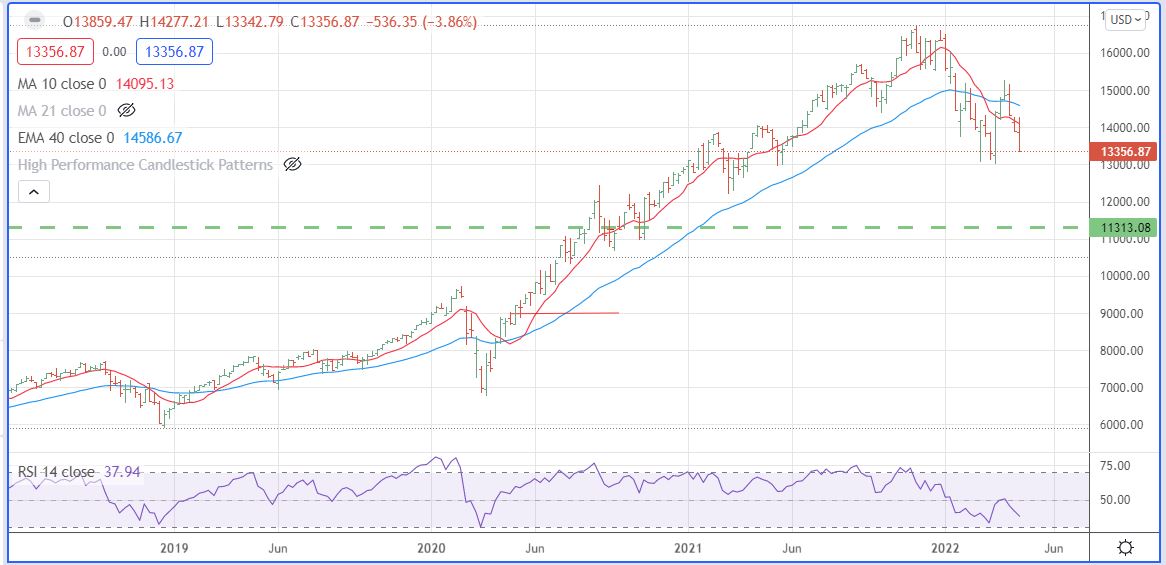
3. Here is chart of the SPX with a green horizontal line that corresponds to August 10, 2020, the date which I often refer to as the date when the FED based stimulus bubble started and the date at which the Balance sheet growth should have stopped.. You can see that SPX prices are holding way above the Bubble floor (which is 3350 and the level that would probably be a target of the Big Crash).

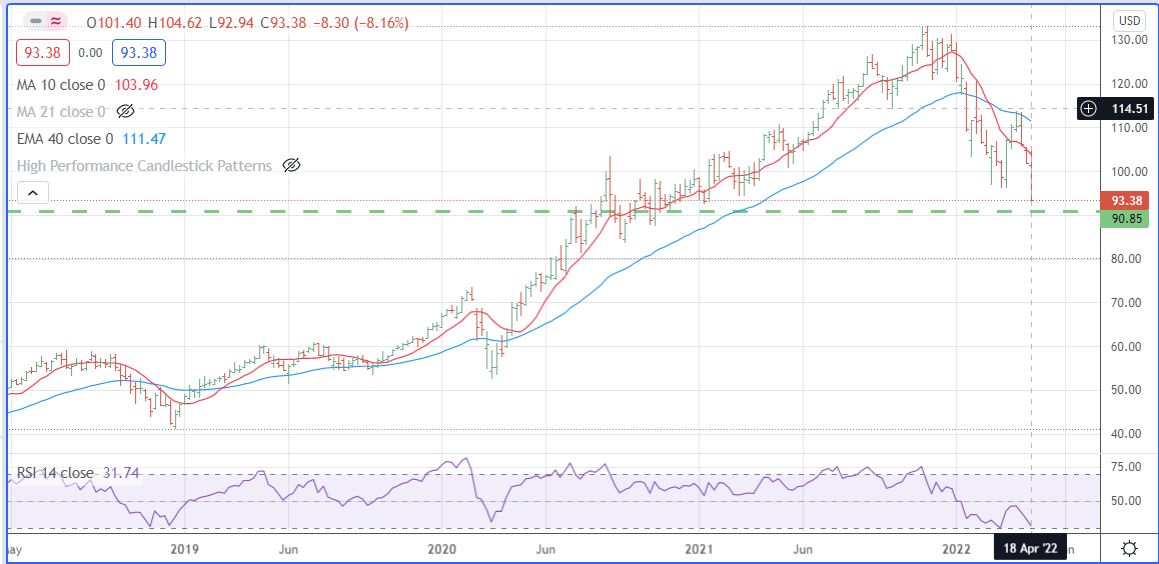
4. Next is the NDX Nasdaq 100 chart. It is much like the SPX chart but has declined a bit more since the top due to FANG influence. Its Big Crash target is 11,310)
5. Here is the first of four charts that tell the real tale of what is going on at the moment. The melt down of the FANG and what I call the Wanna-Be Fangs. This is the FANG chart with the same green line drawn through at the August 2020 level It is an unweighted chart of all the Fang stocks.. You can see this index has declined close to the green line this past week. This may be significant.
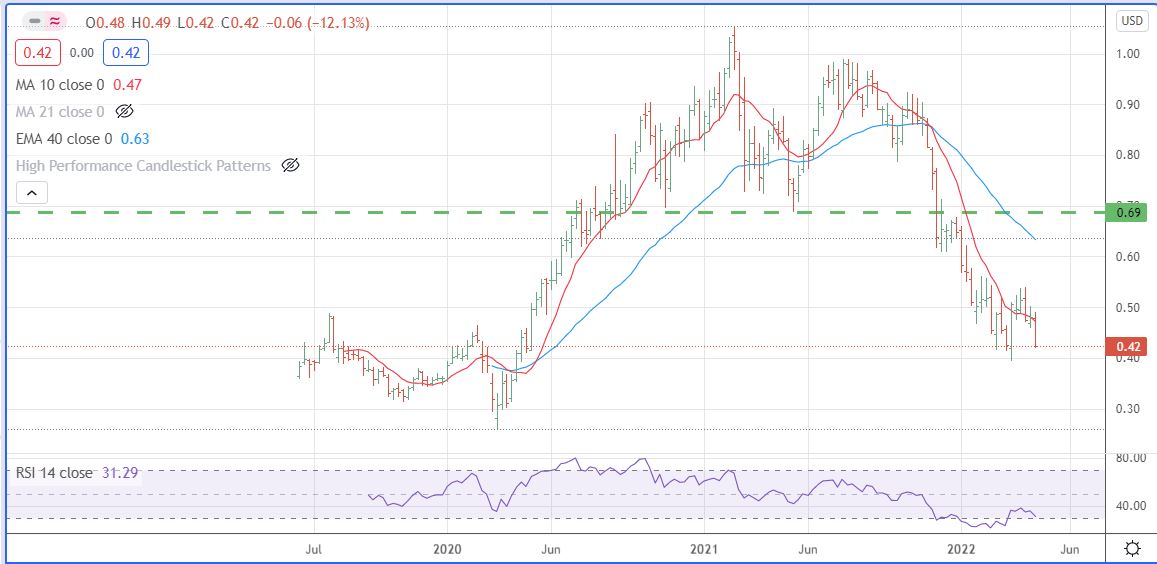
6. And this chart of the WANNA-BE FANGS, the stocks that the CNBC Half TIME show touted aggressively during COVID, In fact that is how I came up with this index which we calculated. It includes the following stocks: SHOP<SPLK<DOCU<ZM<BYND<TTD<OKTA<ROKU<SQ<CRWD. You can see that these stocks have blown through the August 2020 level and have even gone down to the COVID breakout level of March 2020. Does this say a lot of the fluff is gone ???
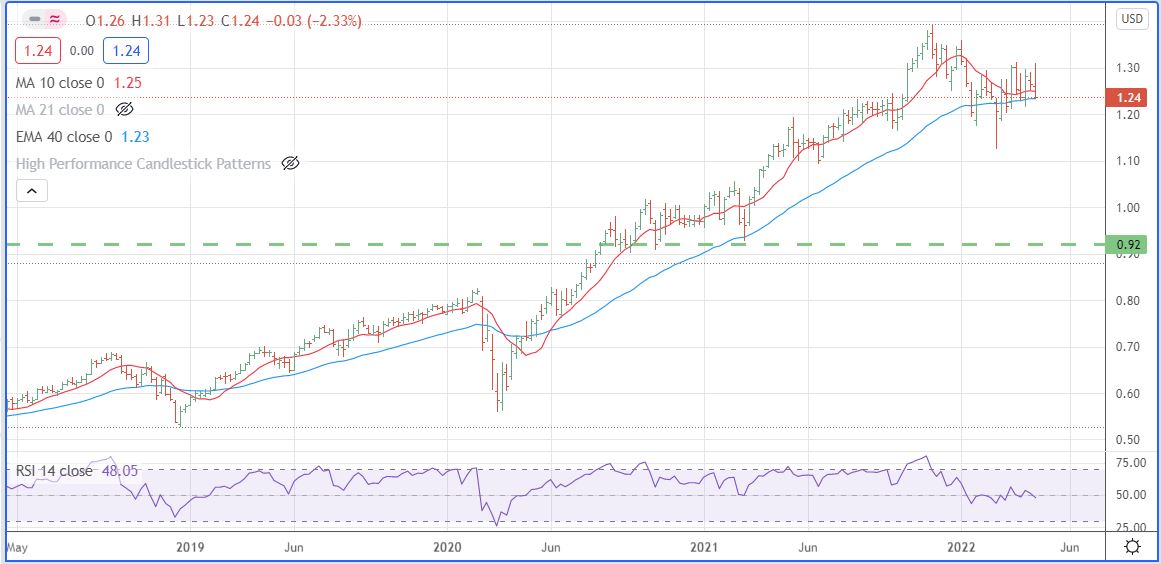
7. And one last chart that I watch to see how the free money is acting, this is an index made up of: WMT<COST<TGT<LOW<BBY<TSCO<AXP. It is an equally weighted chart that tells another story, retail and the consumer is flush at the moment. It is kind of funny, it looks a lot like the SPX chart.
Bottom line; there is a lot to think about here, whether you are bearish or bullish in terms of the direction coming out of the SPX 4150 to 4662 trading range.
Leave a Reply