Market Puzzle Change Coming
We have added some further analysis following today’s close.
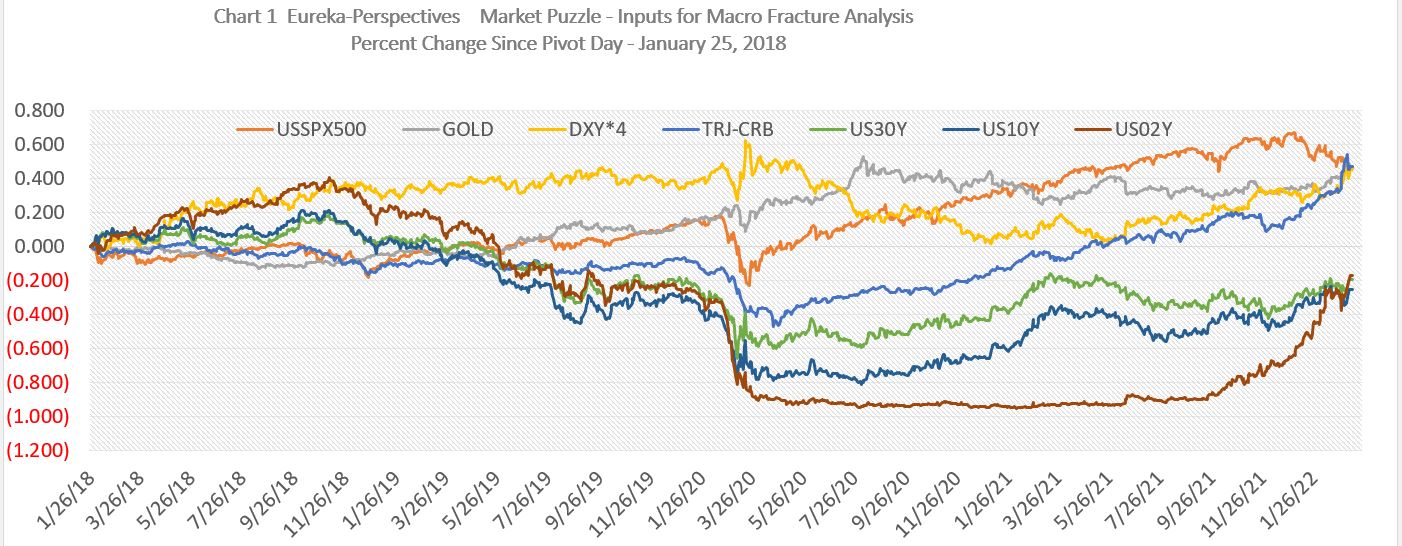
We periodically post our Market Puzzle chart, which shows the percentage change in various indexes versus the January 26, 2018 juncture point. That was the point where Trump’s Tax and Tariff issues started the economic tumult.
Here is the chart:
There is a lot of info in this chart, so let’s first break it down into two areas:
1) major economic factors,
2) interest rates.
At the outset, it should be obvious that the makeup of the chart has everything starting together in January 2018, then the big Covid convulsion in March 2020, and then the two areas of convergence currently, one for percent change in major economic factors and another for percent change of the various interest rates.
looking at the Economic Factors..
Digging deeper into the major economic factors, we see that most of these factors have risen around 50 percent for the period Since January 2018 (taking into account of how we apply the less volatile dollar to this chart, more on that later).
Looking at each of these economic factors individually, we note the following:
- Stocks basically declined into March 2020 and then thanks to the FED have had a large increase in price.
- Gold has had an uneasy rise, making a FED bounce high in August 2020 and then a recent bounce based on inflation and the Ukraine invasion.
- Commodities basically were in the last of a deflation wave into May 2020, and then at a slower rate rode the FED money until the recent explosive catchup phase.
- For the use in this chart, because of the relatively lower volatility of the dollar we multiply the dollar change value by 4X to put the ups and downs into perspective for analysis.
- Bottomline, the four factors come together at around a plus 50 % change since January 2018, albeit at different rates at different times.
Next on the interest rates…
First, the biggest difference between these two areas of the puzzle that jumps out is that the various interest rates are currently about 25 percent below where they were in January 2018.
- First looking at the 30 year rate, it dropped the least and has risen the least during the whole time period.
- The 10 year rate fluctuated in the middle.
- And the 2 year rate, the one the FED pushes around the easiest, dropped and rose the most.
- Bottomline, all three rates are now converging on around a 25 percent decline since January 2018.
What do these two areas of convergence mean?
My hypothesis includes:
- We are still in the asset bubble, albeit in the lower part of that bubble,
- The period since December 1, 2021, as of today a 3.5-month period, has been a setup period with a move to convergence. During this convergence we have seen stocks decline, while gold, commodities, dollars and interest rates pushed pushed higher.
- Out of this convergence there is a strong probability of a move to the top side of the bubble,
- What that means to me is, a strong probability that for the coming period, up to maybe July 1, the moves of the past 3.5 month period will be reversed, stocks rallying, while the dollar, commodities , and interest rates decline, and gold goes back to its listless manner.
- One clue I will be watching for, is the yield curve steepening after the FED followers finish their interest rate push over the meeting period.
- A big thing you have to keep in the back of your mind at this point, the FED has not done anything yet and probably will not do much now, yet it has a huge following of traders who pile on and create an influence trail..
- So what is different now, the pile on crowd over the past few years had hooked itself to big FED stimulus and that stimulus made them a lot of money.
- Now however the pile on crowd is hooking on to negative negative FED rhetoric, not a negative FED stimulus drawdown. We’ll see how well a negative rhetoric trail will work after the market pressure of the initial short positions are complete.
Leave a Reply