Step Back, Macro Time
There are a lot of factors coming together this month. In a sense the numbers, the FED and commentators are finally admitting that the markets are not about productivity and earnings, but solely about the Funny Money pile that commenced in 2006 and has never stopped.
Here is an update of the Macro Asset chart, an arithmetic index of stocks, bonds, junk bonds, commodities, gold, bitcoin, and real estate. In essence where the money has gone.
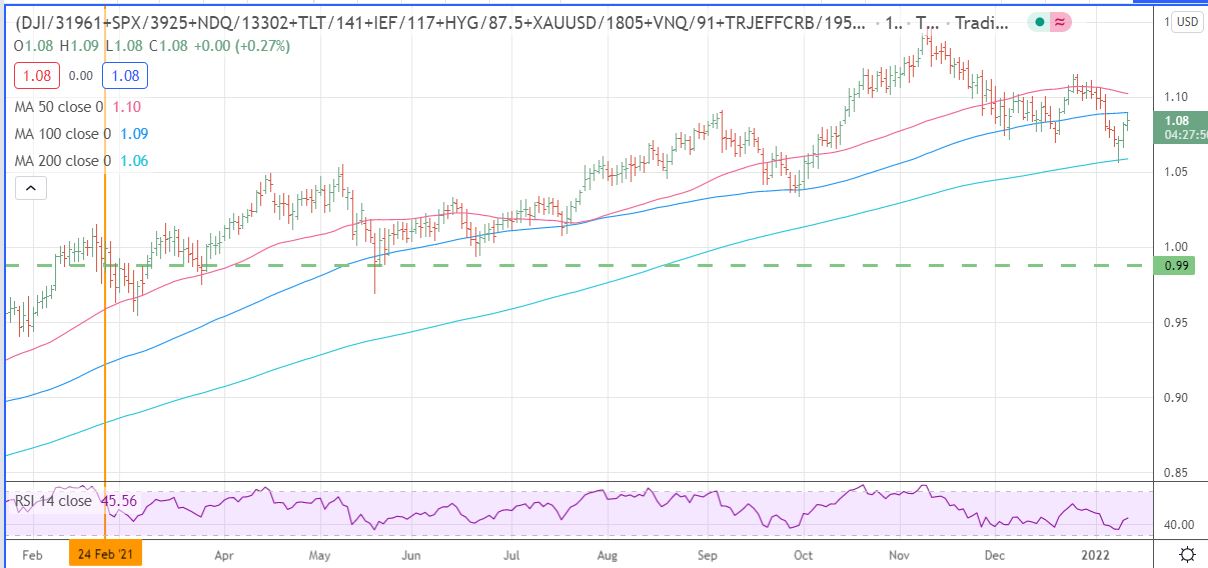
Here are a number of high points that the chart points out:
1) February 24, 2021, where the Bubble phase started after the 15 year leadup.
2) November 9, 2021, the peak.
3. January 5, 2022, where the 50 day average turned down.
4. January 10, 2022, where the 200 day average was touched.
5. January 12, 2022, where the bounce touched the 100 day average.
How does this unfold.?
- Powell will stay behind the curve, because that is who he is and has been, a promoter of greed.
- So Fed Fund rates will not be a factor.
- At the moment my vote in terms of a surprise is 4th quarter earnings, the inventory report increases, for everything but oil, that we have been witnessing are telling a story in terms of sales.
Leave a Reply